Automated jar packaging improves OEE from 43% to 72%, a 67% increase in effective production capacity through better availability, performance, and quality metrics.
Equipment selection requires matching technology to product characteristics: piston fillers for liquids and pastes (±0.5-1.0% accuracy), gravimetric systems for high-value products (±0.1-0.5% accuracy), and multihead weighers for difficult-to-handle solids.
Typical payback periods range from 18-48 months on mid-volume line investments of $850,000, driven by $280,000 in annual savings from labor reduction, waste elimination, and increased throughput.
Line balancing prevents bottlenecks: identify the constraint machine (slowest actual throughput) and match upstream/downstream equipment speeds, with 2-5 minutes of accumulation buffer before bottlenecks.
American-made equipment provides operational advantages: 2-3 day parts shipping from US warehouses versus 6-8 weeks from overseas, English-speaking technical support, and built-in FDA/GMP compliance for regulated industries.
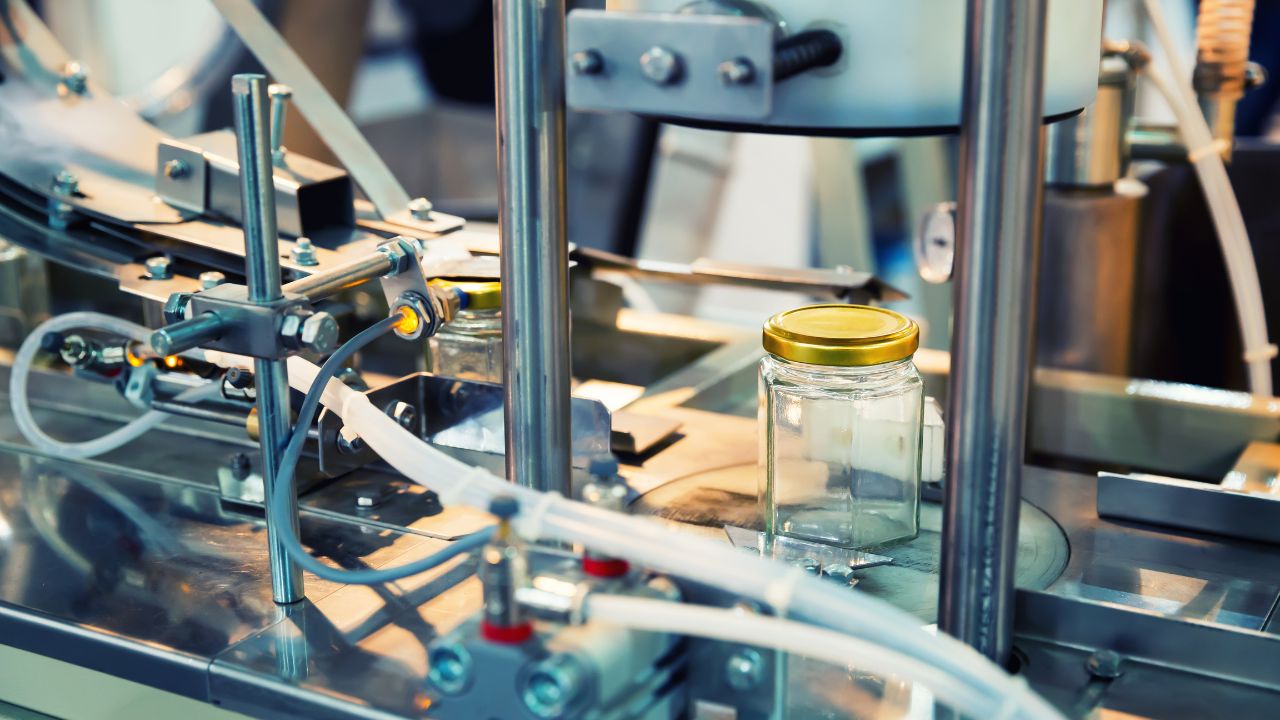
A fully automated container packaging system transforms bulk product into sealed, labeled, ready-to-ship containers with minimal human intervention. The system integrates four synchronized zones: Infeed, Filling & Capping, Labeling & Coding, and End-of-Line, each performing specialized tasks at speeds from 50 to 1,000+ jars per minute depending on configuration.
Success requires matching equipment capabilities to your specific product characteristics, container specifications, and production throughput requirements. A salsa manufacturer needs different filling technology than a supplement powder producer. Glass jars require different handling than plastic. High-mix operations demand faster changeovers than dedicated lines.
This guide provides the technical specifications, speed ranges, and accuracy tolerances needed to evaluate jar packaging automation equipment. All data comes from OEM documentation and real-world performance metrics, not marketing claims. For operations managers facing labor shortages, CFOs evaluating ROI, or engineers designing new lines, these specifications provide the foundation for informed equipment decisions.
The Core Stages Of Automated Jar Packaging
Automated jar packaging is divided into three critical process stages: filling, sealing, and labeling. Each stage offers multiple technology options with distinct speed, accuracy, and product compatibility characteristics.
Filling Technologies And Capabilities
Filling technology selection depends on product viscosity, particulate content, and required accuracy. The four primary options cover liquids, powders, and solids:
Key advantage: High speed and accuracy for difficult-to-handle products
For detailed specifications on volumetric and gravimetric weighers and fillers, manufacturer documentation provides critical selection criteria based on product characteristics.
Sealing And Capping Systems
Capping equipment secures closures, while sealing systems provide tamper evidence and shelf life extension. Speed requirements dictate technology choice:
Chuck Cappers
Speed: 50-300+ JPM
Torque control: High precision (servo-driven, 5-50 inch-pounds)
Best for: Consistent torque application on dedicated high-speed lines
Spindle Cappers
Speed: 50-400+ JPM (highest speed option)
Torque control: Medium precision (wheel slip method)
Best for: Flexible operations handling multiple cap sizes
Induction Sealing
Speed: Up to 60 meters per minute
Power: 1-6 kW depending on cap diameter
Function: Creates a hermetic, tamper-evident seal by bonding the foil liner to the jar rim
Shrink Banding
Speed: 100-500 JPM
Process: Heat tunnel at 150-200°C shrinks band over cap
Dual function: Tamper evidence plus decorative appearance
A reliable jar sealing machine integrates capping and secondary sealing in a single automated station, reducing floor space and improving line efficiency.
Labeling Technologies
Labeling systems apply branding, regulatory information, and variable data. Technology choice balances speed, accuracy, and flexibility:
Market position: Most common technology for jar packaging
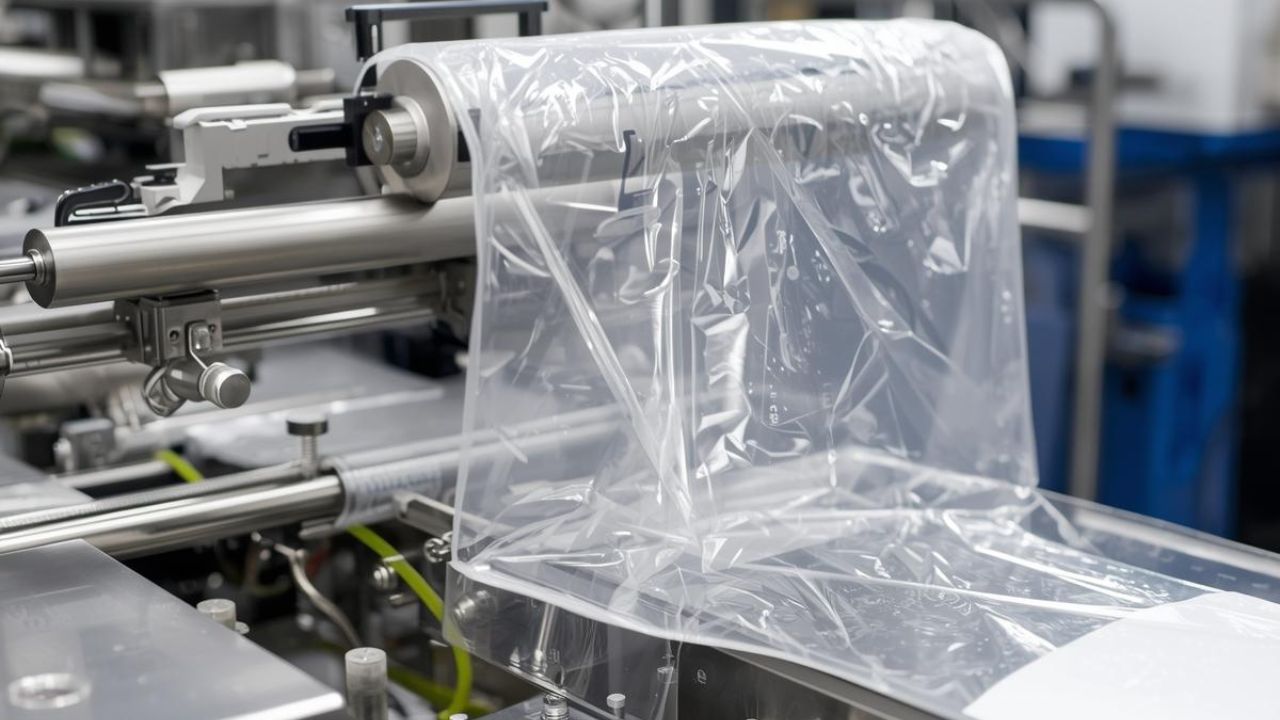
Sleeve Labeling
Speed: 100-600 JPM
Coverage: 360° full-body decoration
Materials: PVC, PETG, PLA sleeves
Key advantage: Premium appearance with shrink-to-fit conformity
Print-and-Apply Systems
Speed: 40-150 JPM (slower but flexible)
Placement accuracy: ±1.0mm to ±2.0mm
Function: Real-time printing of lot codes, expiration dates, and serial numbers
Essential for: Track-and-trace compliance and GS1 serialization
Modern jar labeling machine configurations incorporate vision guidance systems for ±0.5mm placement accuracy and automated defect detection.
Equipment Comparison: Choosing The Right Technology
Selecting optimal equipment requires balancing speed, accuracy, product compatibility, and changeover requirements. These comparison tables provide decision-making data based on technical specifications and real-world performance.
Filling Equipment Comparison Table
Technology
Product Type
Speed (JPM)
Accuracy
Best For
Piston Filler
Liquids, creams, pastes, particulates
20-200
±0.5-1.0%
Versatile applications, wide viscosity range
Auger Filler
Powders, granules, spices
30-150
±1.0-2.0%
Dry products require dust control
Gravimetric
High-value, inconsistent density
20-100
±0.1-0.5%
Minimizing giveaway, premium products
Multihead Weigher
Nuts, snacks, candy
60-200
±0.5-2g
Difficult-to-handle solids
Key Decision Factors:
Piston fillers handle the widest product range, but require cleaning between product changes
Gravimetric systems justifya higher cost when product value exceeds $10-15 per pound
Multihead weighers excel with non-free-flowing solids that jam volumetric systems
Sealing And Labeling Equipment Comparison Tables
Sealing Technology Comparison
Technology
Speed (JPM)
Key Feature
Application
Chuck Capper
50-300+
Precise torque control
High-speed dedicated lines
Spindle Capper
50-400+
Maximum flexibility
Multiple cap sizes
Induction Sealing
60 m/min
Hermetic seal
Tamper evidence required
Shrink Banding
100-500
Decorative option
360° tamper evidence
Labeling Technology Comparison
Technology
Speed (JPM)
Accuracy
Best Application
Pressure-Sensitive
50-500+
±0.5-1.5mm
Most common, versatile
Sleeve Labeling
100-600
Conforms to shape
Premium 360° graphics
Print-and-Apply
40-150
±1.0-2.0mm
Variable data, serialization
Technology Selection Guidelines:
Chuck cappers provide consistent torque for quality-critical applications (pharmaceuticals, supplements)
Sleeve labeling justifies higher material costs when brand differentiation drives purchasing decisions
Print-and-apply systems are mandatory for FDA serialization compliance and track-and-trace requirements
How Automation Improves Efficiency And Quality
Automation delivers measurable improvements across three performance dimensions: throughput, labor efficiency, and product consistency. Real-world data demonstrates the financial and operational impact.
Efficiency Improvements From Automation
Production Capacity Gains
Overall Equipment Effectiveness (OEE) improves from 43.1% (manual/semi-automated) to 71.8% (fully automated), a 67% increase in effective production capacity from the same equipment footprint. This improvement breaks down across three factors:
Availability: 72% to 88% (reduced unplanned downtime, faster changeovers)
Performance: 68% to 85% (consistent speed without operator fatigue)
Quality: 88% to 96% (precise filling, consistent capping, automated inspection)
Throughput example: Mid-sized salsa manufacturer increased from 60 JPM (manual operation) to 150 JPM (automated container filling line), a 150% increase, enabling $2M in new contract fulfillment.
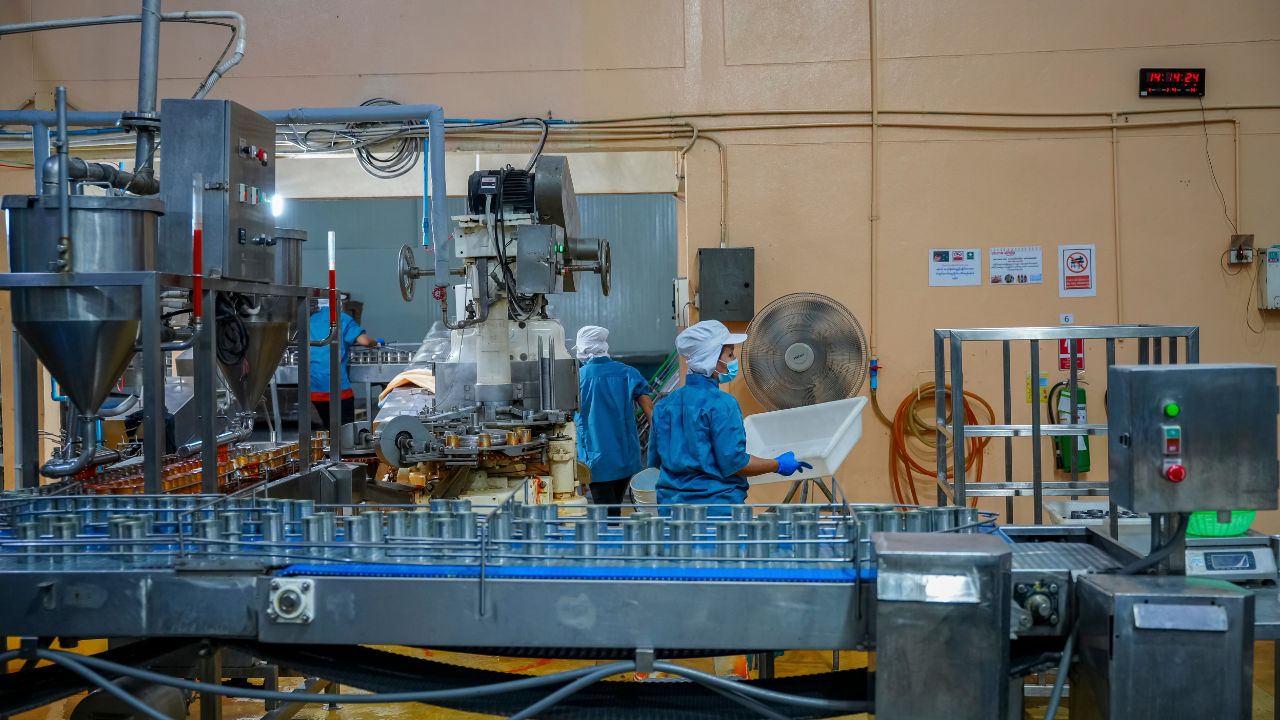
Labor Cost Reduction
Automation reduces packaging labor requirements by 4+ full-time equivalents per line:
Annual labor savings: $160,000-$180,000 per line
Real-world example: A supplement manufacturer operates with 6 operators (automated) versus 18 operators (manual)
Eliminates dependency on difficult-to-fill packaging positions with 40%+ annual turnover
Waste And Giveaway Reduction
Precise filling control dramatically cuts product waste:
Gravimetric systems: Product overfill reduced from 3% to 0.3% (90% reduction)
High-value products: Annual savings exceed $100,000 for premium supplements and cosmetics
Overall waste reduction: 75% decrease in spillage, overfill, and damaged product
Quality reject rate: Drops from 4% to 0.8% (67% reduction)
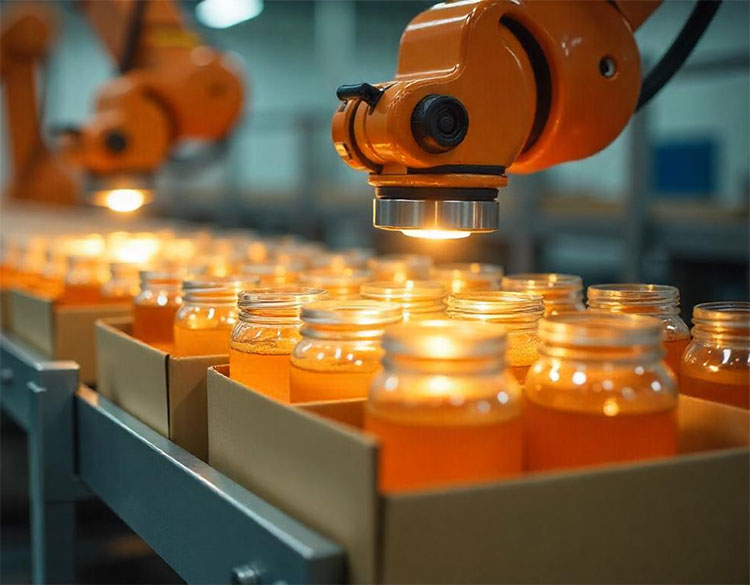
Quality Consistency Benefits
Fill Accuracy Improvements
Automated systems eliminate human judgment variability:
Gravimetric fillers: ±0.1-0.5% accuracy versus ±2-3% manual variation
Servo-driven volumetric control: Real-time monitoring and micro-adjustments
Automated induction sealing achieves 99.8% seal integrity compared to 96% with manual capping operations. Consistent torque application (5-50 inch-pounds) through servo motors prevents both under-tightened (leakage) and over-tightened (cap damage) failures. Real-time monitoring systems detect and reject defects before case packing.
Vision inspection: <0.5% false reject rate while detecting true defects
Orientation systems: ±2° to ±5° rotational accuracy for feature-specific label placement
Quality consistency reduces customer complaints, supports premium pricing, and simplifies regulatory compliance for FDA-audited facilities. Advanced inspection systems integrate with labeling equipment to verify placement accuracy and reject defective packages automatically.
Key Considerations When Selecting Automated Systems
Equipment selection requires balancing speed requirements, accuracy tolerances, changeover frequency, and facility constraints. The wrong choice creates bottlenecks, excess downtime, or insufficient capacity for growth.
Critical Selection Factors
Speed And Production Requirements
Match equipment speeds to actual production targets, not theoretical maximums:
Low-speed lines: 50-120 JPM for specialty or high-mix operations
Mid-speed lines: 200-400 JPM for standard production environments
High-speed lines: 600-1,000+ JPM for dedicated, high-volume products
Line balancing prevents bottlenecks. A 350 JPM filler feeding a 275 JPM case packer limits the entire line to 275 JPM. Identify the constraint machine (slowest actual throughput) and match upstream/downstream equipment speeds accordingly. Add accumulation immediately before bottlenecks to prevent starvation.
Standard products: ±0.5-1.0% accuracy (piston fillers) sufficient for most food applications
High-value products: ±0.1-0.5% accuracy (gravimetric fillers) justify higher cost when product value exceeds $10-15 per pound
Example: Reducing overfill from 3% to 0.3% saves $100,000 annually on premium supplements at $85 retail price per unit.
Flexibility And Changeover Speed
High-mix operations require fast changeovers to maintain productivity:
Rotary systems: 10-20 minute changeovers with dedicated change parts
Inline systems: Under 5 minutes, often tool-less adjustment
Robotic unscramblers: Near-instantaneous changeovers, handle 10mL to 9.5L containers with minimal or no change parts
Modern case packers: Under 1 minute via stored software recipes
Calculate changeover impact: Three 20-minute changeovers per day equals 1 hour of lost production. At 200 JPM, that's 12,000 lost units daily. Understanding the differences between semi-automatic vs fully automatic systems helps determine the right level of automation for changeover-intensive environments.
PLC coordination: A single control system synchronizes multiple machines, preventing pressure points
Future expansion: Modular designs allow capacity upgrades without replacing the entire line
Compliance And Sanitation Requirements
Food, beverage, and pharmaceutical operations face strict regulatory requirements:
Material standards: 304/316 stainless steel for food contact surfaces
Washdown capability: IP65 or higher rating for direct spray cleaning
Tool-less disassembly: Quick access for cleaning and inspection
Built-in compliance: Data logging, validation protocols, audit trail capability for FDA/GMP requirements
Costs And ROI Of Jar Packaging Automation
Automation requires significant upfront capital but delivers measurable returns through labor reduction, waste elimination, and increased capacity. Understanding the total cost of ownership and realistic payback timelines supports informed investment decisions.
Initial Investment Breakdown
Equipment Costs By Configuration
Capital investment scales with speed and complexity:
Throughput gain value: $65,000 (increased capacity enables additional revenue)
Five-Year Financial Timeline
Year
Cumulative Cost
Cumulative Savings
Net Position
0
$850,000
$0
-$850,000
1
$892,000
$280,000
-$612,000
2
$934,000
$560,000
-$374,000
3
$976,000
$840,000
-$136,000
4
$1,018,000
$1,120,000
+$102,000
5
$1,060,000
$1,400,000
+$340,000
Key Performance Metrics
Payback period: 4 years (when cumulative savings exceed cumulative costs)
5-year ROI: 40% return on initial investment
5-year net benefit: +$340,000 positive cash flow
High-volume operations: Payback as short as 12-24 months with greater labor intensity and higher throughput gains
Operations with higher labor costs, premium product values, or capacity constraints achieve faster payback. Calculate your specific ROI using actual labor rates, product costs, and production volumes.
Common Challenges And Troubleshooting
Even well-designed automated systems experience operational issues. Understanding common failure modes and proven solutions minimizes downtime and maintains OEE targets.
Filling System Issues
Common Problems And Root Causes
Fill variability stems from four primary sources:
Inconsistent product viscosity due to temperature fluctuation or mixing issues
Air trapped in the filling system is creating erratic flow
Worn filler seals and O-rings are causing pressure loss
Product supply issues (low tank level, inadequate agitation)
Proven Solutions
Systematic troubleshooting resolves most filling issues:
Check product consistency: Verify temperature within ±2°C of specification, confirm proper mixing
Purge air: Run purge cycle to remove trapped air from lines and manifolds
Replace seals: Follow OEM preventive maintenance schedule (typically every 3-6 months for high-volume operations)
The photo-eye sensor misalignment detects the wrong reference point
Upstream orientation system failure (±2° to ±5° accuracy required)
Proven Solutions
Preventive maintenance and proper setup eliminate most labeling defects:
Replace worn parts: Sponges, rollers, and tamp pads lose effectiveness with use
Adjust sensors: Position the photo-eye to detect the jar's leading edge accurately
Verify orientation: Confirm upstream system achieves ±2-5° rotational accuracy
Set up consistency: Document and replicate guide rail positions using setup jigs
Surface preparation: Ensure jars are clean and dry for proper adhesion
Vision inspection systems (<0.5% false reject rate) automatically detect and divert defective packages before case packing, preventing customer complaints and protecting brand reputation.
Maintenance Best Practices For Longevity
Preventive maintenance protects equipment investment and sustains performance gains. Scheduled tasks prevent failures, while proper parts inventory minimizes downtime when issues occur.
Visual inspection: Check for loose components, leaks, unusual wear patterns
Vision system cleaning: Wipe camera lenses and lighting sources to maintain <0.5% false reject rate
Weekly And Monthly Tasks
Scheduled verification maintains accuracy:
Filler calibration check: Verify fill accuracy within specification (±0.5% to ±2.0% depending on technology)
Guide rail maintenance: Clean and lubricate to prevent container jams
Applicator inspection: Check sponges, rollers, and tamp pads for wear
Component Replacement Schedule
Follow OEM preventive maintenance intervals:
O-rings and seals: Replace every 3-6 months for high-volume fillers (prevents fill variability)
Chuck inserts and spindle wheels: Replace per manufacturer schedule (typically 6-12 months at 300 JPM operation)
Applicator components: Sponges, rollers, and tamp pads show wear after 3-6 months of continuous use
Parts Availability And Technical Support
American-made equipment advantages:
US-based parts warehouses: 2-3 day shipping versus 6-8 weeks from overseas suppliers
Lifetime technical support: Direct access to engineers who designed the equipment
Remote troubleshooting: Minimize downtime through remote diagnostics and PLC access
On-site service: Available when remote support is insufficient
Equipment Longevity And ROI Extension
Proper maintenance extends investment returns:
Stainless steel construction: 15+ year equipment life with proper care
Modular design: Upgrade components without replacing the entire machine
ROI extension: Equipment operating beyond a 4-year payback period generates pure profit from labor savings and increased capacity
Making The Automation Decision
Automating jar packaging boosts efficiency, quality, and cost savings. Key benefits include a 67% increase in production capacity (from 43% OEE to 72% OEE), labor savings of $160,000-$180,000 annually, and a significant reduction in reject rates and product waste. Financially, a typical $850,000 investment pays back in 18-48 months, with high-volume operations seeing returns in 12-24 months. A 5-year ROI of 40% ensures long-term profitability.
Automation is ideal for operations facing labor shortages, the need for higher capacity, or quality consistency demands. Equipment should match production speeds (50-1,000+ JPM) and accuracy (±0.1% to ±2.0%), and comply with FDA and GMP standards. Successful implementation depends on proper training, facility preparation, and strategic timing.Ready to eliminate labor shortages and increase production capacity? Contact Wolf Packing's engineering team for a free consultation on automating your jar packaging line with solutions like automatic counting machine integration for precise unit accuracy.
At Wolf-Packing Machine Company, we believe that the key to success is a commitment to excellence in everything we do. That’s why we use only the highest quality materials and the most advanced technology to create packaging machines that are efficient, reliable, and cost-effective.
What’s new at Wolf Packing?
// <#?php
// /**
// * Exclude Current Posts from the query
// */
// add_action( 'pre_get_posts', function ( $query ) {
// // not an admin page and not the main query
// if ( ! is_admin() && ! $query->is_main_query() ) {
// $query->set( 'post__not_in', array( get_the_ID() ) );
// }
// } );
// ?>
From design through testing, installation and beyond, we work tirelessly to ensure your equipment is running at peak performance and maximizing your application. To learn more about our machines, reach out to set up a free consultation with our in-house experts.
From weigh filling, bagging, wrapping and conveying to capping, labeling, cartoning, case/tray forming, packing and palletizing, we offer packaging solutions for a diverse array of applications.