Labor Reduction is Substantial and Proven: Automation consistently delivers 40-80% labor cost reduction, with fully automatic systems eliminating 11-18 FTE per packaging line while increasing throughput 16-80x.
Payback Periods Are Rapid: Well-sized automation projects achieve payback in 6-24 months, with high-volume operations (>500,000 units/year) reaching breakeven in under a year while delivering 5-year ROI exceeding 500%.
Quality Improvements Drive Hidden Savings: Beyond labor, automation reduces defects by 90%, cuts product giveaway from 5-6% to 1-2% (saving $80,000+ annually), and improves OEE from 38-60% to 69-90%+.
Total Cost of Ownership Favors Automation: Despite higher upfront investment ($75,000-$350,000), fully automatic systems cost 50% less over 5 years ($875,000 vs. $1.77M manual) due to dramatically lower labor costs.
The Decision Threshold is Clear: Production volumes above 100,000 units/year justify automation investment, with volumes above 500,000 units/year making full automation essential for competitive survival.
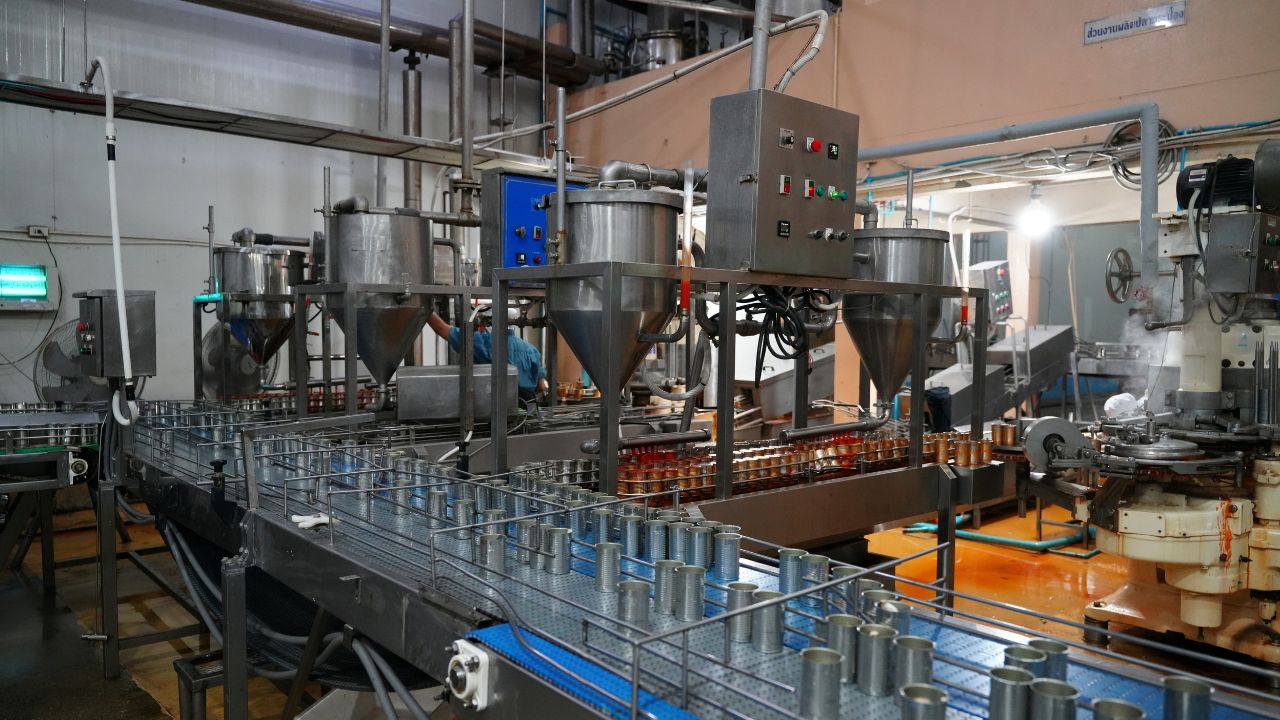
Labor dominates packaging costs in manual operations, consuming up to 60% of total expenses.Food packaging automation directly addresses this burden through workforce restructuring and productivity gains. The results are measurable: consistent labor cost reductions of 40% or greater, with payback periods ranging from 6 to 24 months depending on production volume and automation level.
Understanding Food Packaging Automation
Packaging automation spans three distinct tiers, each offering different labor and capital trade-offs. The right choice depends on production volume, product variety, and growth trajectory.
Automation Levels and Capabilities
Manual Systems ($3,000-$5,000)
3-8 workers per line
5-20 units/minute throughput
High labor dependency, minimal capital investment
Best for: Low-volume production (<10,000 units/year)
Semi-Automatic ($15,000-$80,000)
1-3 workers per line
20-80 units/minute throughput
40-60% labor reduction vs. manual
Integration costs: 10-20% of equipment cost
Best for: Medium-volume production (10,000-500,000 units/year)
Fully Automatic ($50,000-$250,000+)
0.5-1 supervisor per line
80-400+ units/minute throughput
60-80% labor reduction vs. manual
Multi-machine supervision: up to 10:1 ratio
Integration costs: 20-30% of equipment cost
Best for: High-volume production (>500,000 units/year)
Key Process Technologies:
Precision multi-head weighers: ±0.5-2% accuracy vs. ±5-10% manual variance
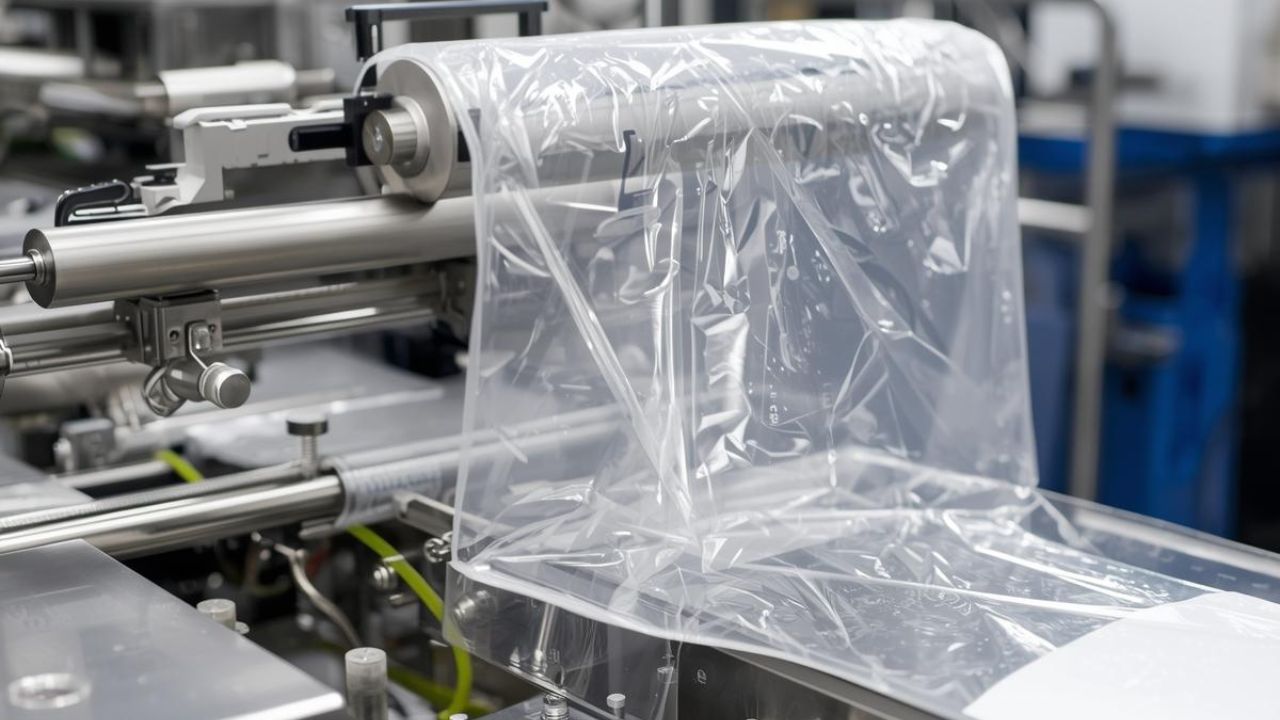
Automated form-fill-seal systems:Integrated filling, sealing, and cutting
Robotic case packing and palletizing: Up to 240 units/minute
End-of-line integration: 35-50% throughput improvement with 70% labor reduction
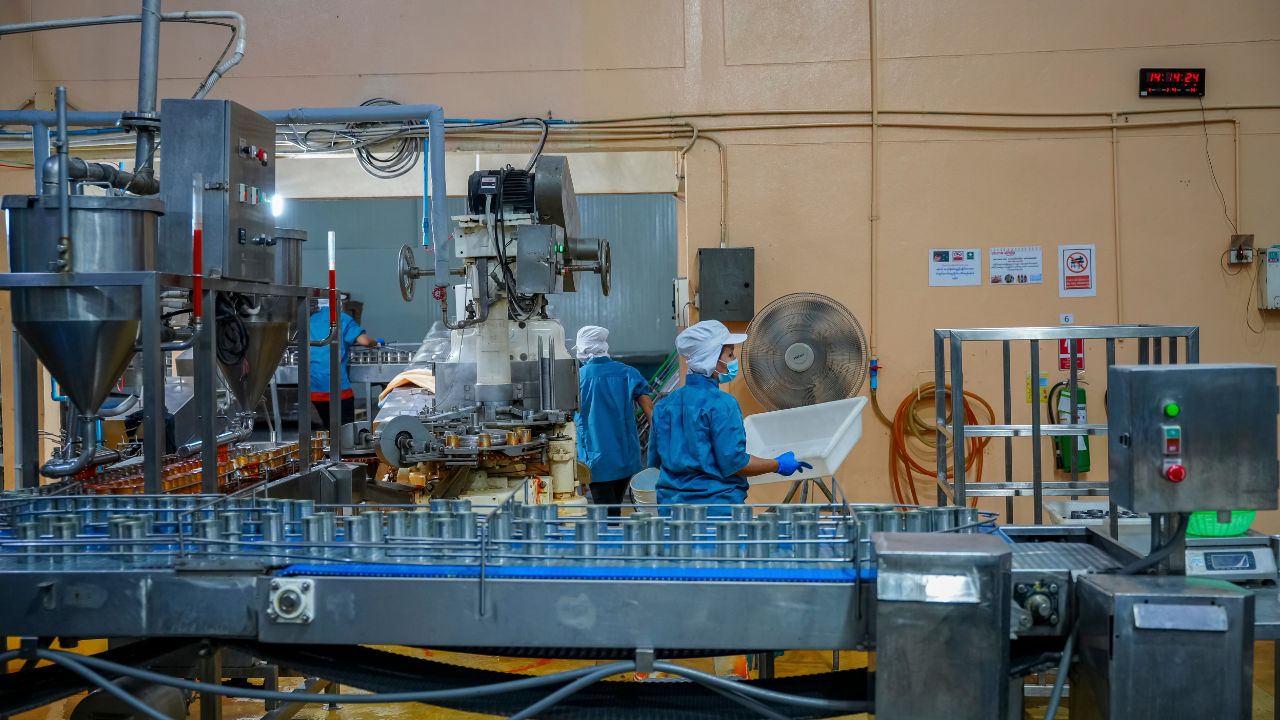
The 40%+ Labor Cost Reduction: How It Works
Automation restructures labor requirements through task consolidation, speed multiplication, and error elimination. A single operator supervises what previously required 3-8 workers. The math is straightforward: fewer people, higher output, lower cost per unit.
Labor Cost Comparison
Metric
Manual
Semi-Automatic
Fully Automatic
Savings
Operators per Shift
5 workers
2 workers
1 worker
80% reduction
Annual Labor Cost
$125,000-$300,000
$50,000-$120,000
$30,000-$70,000
Up to $230,000/year
Labor Cost per 1,000 Units
$15-$50
$5-$15
$2-$8
60-85% reduction
5-Year Total Labor Costs
$1,500,000
$600,000
$350,000
$1,150,000 saved
Key Labor Reduction Mechanisms
Task Consolidation
Single operator supervises entire line vs. 3-8 manual workers
Operator-to-machine ratio increases from 1:1 to 10:1
Eliminates 11-18 FTE per complete packaging line
Shift Optimization
High throughput consolidates 2 manual shifts into 1 automated shift
Labor savings anchor automation ROI, but secondary benefits amplify returns. Quality improvements, waste reduction, and packaging line efficiency compound the financial case. These gains often match or exceed direct labor savings.
Performance Improvements Driving ROI
Metric
Manual
Automated
Impact on ROI
OEE (Overall Equipment Effectiveness)
38-60%
69-90%+
Each 1% = 1% capacity gain; +40-60 points typical
Quality/Defect Rate
3-5%
0.5-1%
70-85% reduction in scrap and rework costs
Product Giveaway
5-6%
1-2%
3-4% product saved = $80,000+ annually
Changeover Time
10-30 min
15-60 min
65% reduction with automation; enables more SKUs
Workplace Injuries
Baseline
30% of baseline
70% reduction in workers' comp claims
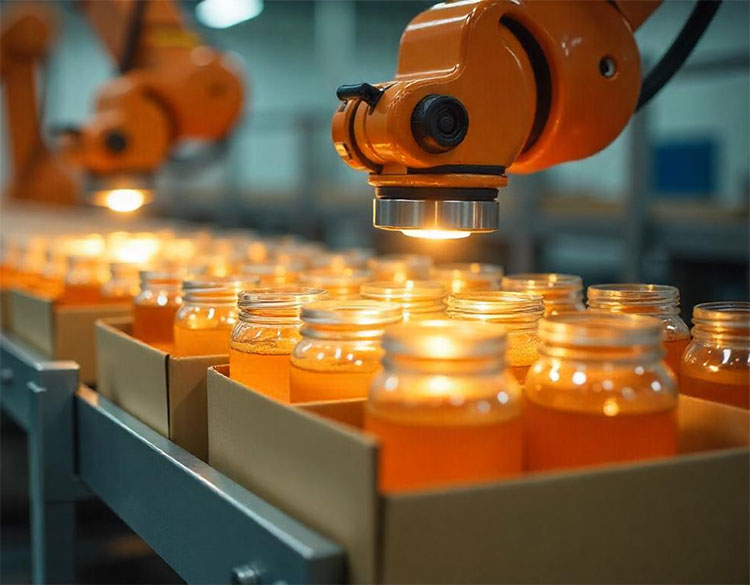
Quality And Efficiency Gains
Precision Improvements:
Fill accuracy: 99.5%+ vs. 92% manual
Consistent seal quality eliminates package failures
Automated inspection at line speed (no production slowdown)
Real-time process control prevents batch losses
Operational Benefits:
Unplanned downtime cost: $5,000-$10,000/hour (mid-size plant) , automation with preventive maintenance reduces by 41%
Material waste reduction: 30% (film, labels, adhesives)
Production scheduling flexibility: 24/7 capable
Data logging provides FDA/GMP compliance documentation
Investment And Payback Analysis
Automation economics scale with production volume. Higher volumes justify larger investments and deliver faster payback. The break-even threshold typically falls between 100,000 and 500,000 units annually, where automation transitions from optional to essential.
ROI By Production Volume
Annual Volume
Equipment Investment
Labor Savings/Year
Payback Period
5-Year ROI
100,000 units
$60,000
$40,000
18 months
300%+
500,000 units
$150,000
$150,000
12 months
500%+
1,000,000 units
$200,000
$285,000
8 months
700%+
5,000,000 units
$300,000
$1,000,000
4 months
1,600%+
Key Decision Thresholds:
<100,000 units/year: Manual or semi-automatic
100,000-500,000 units/year: Strong case for automation (12-24 month payback)
Annual maintenance: 4-5% of CAPEX (preventive maintenance costs 3-5x less than emergency repairs)
5-Year Total Cost of Ownership:
Manual: $1.77M (dominated by labor)
Fully Automatic: $875,000 (50% TCO reduction)
Labor cost per unit at scale: 95% lower with automation
Implementation Roadmap
Successful automation follows a structured timeline spanning 4-10 months from evaluation to full production. Rushed implementations increase risk; phased approaches allow validation and course correction. The five-step framework below mitigates common failure modes.
5 Critical Steps
1. Assessment (1-2 months)
Analyze current labor costs, throughput, and quality metrics
Model ROI at 70%, 85%, 100% capacity utilization
Identify bottleneck operations for maximum impact
2. Vendor Selection (2-3 months)
Obtain quotes from 2-3 qualified suppliers
Verify US-based support and <3 day parts shipping
Review customer references in your industry
Request demonstrations with actual products
3. Installation (2-4 weeks)
Schedule during slower production periods
Budget facility modifications: $5,000-$50,000
Complete validation testing before handoff
4. Training & Ramp-Up (1-3 months)
Comprehensive operator training: 3-5 days on-site
Expect 10-20% temporary productivity dip
Target: >80% OEE within 6 months (critical for ROI)
5. Optimization
Track performance vs. projections
Implement a preventive maintenance schedule
Plan for technology upgrades as the business scales
Addressing Common Concerns
Every automation investment carries perceived risk. Understanding these concerns and their mitigation strategies separates successful projects from failed implementations. The table below addresses the most common objections with proven solutions.
Automation technology continues to evolve beyond current capabilities. The next 5-10 years will bring AI-driven optimization, advanced robotics, and autonomous systems that further reduce labor dependency. Early adopters of these technologies will compound their competitive advantages.
Real-time quality adjustments eliminate human intervention
Advanced Robotics
Labor reduction potential: 85-90% vs. manual
Collaborative robots work safely alongside humans
Vision-guided systems handle product variability
Complete Autonomy
Lights-out manufacturing: 1 technician per 5-10 lines
Zero-changeover flexible systems
Digital twin simulations reduce trial-and-error by 60-80%
Sustainability Integration
Net-zero energy packaging lines
30-50% energy reduction vs. current systems
Optimized sustainable material handling
Making The Automation Decision
Automated packaging equipment offers clear, rapid ROI through labor reduction, quality improvement, and throughput gains. The key question is not whether to automate, but when and where to begin. If your production volume exceeds 100,000 units per year, labor costs are a significant portion of packaging expenses, and you face high turnover or hiring challenges, automation can help.
It is also effective if you have quality consistency issues or expect significant growth. With capital available for investment, automation can reduce labor costs by 60-85%, improve quality with 99.5%+ accuracy, and provide a return of 100-400%+ at high production volumes.
The payback period typically ranges from 6 to 24 months, and the savings can exceed $1 million over five years. To proceed, calculate your specific ROI, identify labor-intensive areas for automation, and consult with qualified vendors to develop a business case. Ultimately, reducing labor costs through automation is essential for staying competitive in today's labor market.Ready to explore automation for your operation? Contact Wolf Packing's engineering team for a free consultation on high performing packaging machines and ROI analysis tailored to your production requirements.
At Wolf-Packing Machine Company, we believe that the key to success is a commitment to excellence in everything we do. That’s why we use only the highest quality materials and the most advanced technology to create packaging machines that are efficient, reliable, and cost-effective.
What’s new at Wolf Packing?
// <#?php
// /**
// * Exclude Current Posts from the query
// */
// add_action( 'pre_get_posts', function ( $query ) {
// // not an admin page and not the main query
// if ( ! is_admin() && ! $query->is_main_query() ) {
// $query->set( 'post__not_in', array( get_the_ID() ) );
// }
// } );
// ?>
From design through testing, installation and beyond, we work tirelessly to ensure your equipment is running at peak performance and maximizing your application. To learn more about our machines, reach out to set up a free consultation with our in-house experts.
From weigh filling, bagging, wrapping and conveying to capping, labeling, cartoning, case/tray forming, packing and palletizing, we offer packaging solutions for a diverse array of applications.