Labor Dominates TCO: Labor represents 62% of packaging equipment Total Cost of Ownership over 5 years, making automation payback periods of 12-48 months achievable through headcount reduction from 20 workers to 5 workers ($400,000 annual savings).
Accuracy Drives Material Savings: Improving fill accuracy from ±2% (manual) to ±0.1% (multihead weigher) eliminates $95,000 in annual product giveaway on 1 million packages of $5/kg product; accuracy improvements pay for equipment upgrades.
Changeover Speed Impacts OEE: Reducing changeover time from 30 minutes to 15 minutes (2 changes per 8-hour shift) improves Overall Equipment Effectiveness by 6-8 percentage points. SMED-optimized designs deliver faster format changes and higher uptime.
Vendor Support Prevents Downtime: US-based manufacturers deliver replacement parts in 2-3 days versus 6-8 weeks from overseas suppliers, reducing unplanned downtime 30-50% and preventing $15,000-$30,000 in lost production per failure incident.
Industry 4.0 Enables Predictive Maintenance: AI-based vision systems (29% of new installations) and IoT sensor monitoring deliver 5-10% OEE improvement through early failure detection. Modern equipment includes cloud connectivity and predictive analytics as standard features.
Food manufacturers face a critical inflection point: manual packaging operations can't scale to meet demand while labor shortages push costs 40% higher year-over-year. Operations directors at growing companies are managing the impossible, increasing output 50-100% while reducing headcount and maintaining quality consistency for FDA compliance. The solution lies in packaging automation, but the path from manual to automated isn't straightforward.
This comprehensive guide explains how packaging machines work, what technologies deliver measurable ROI, and how to select food packaging machinery that solves real operational problems, not just replaces labor. We'll cover the engineering fundamentals of filling systems, the financial reality of Total Cost of Ownership (labor represents 62% of 5-year TCO), and the vendor evaluation criteria that separate reliable American manufacturers from overseas suppliers shipping packaging equipment that arrives 4 months late with missing parts.
Whether you're packaging powders at 30 bags/minute or scaling to 300 units/minute with multihead weighers, this guide provides the technical and financial framework for making confident automation decisions.
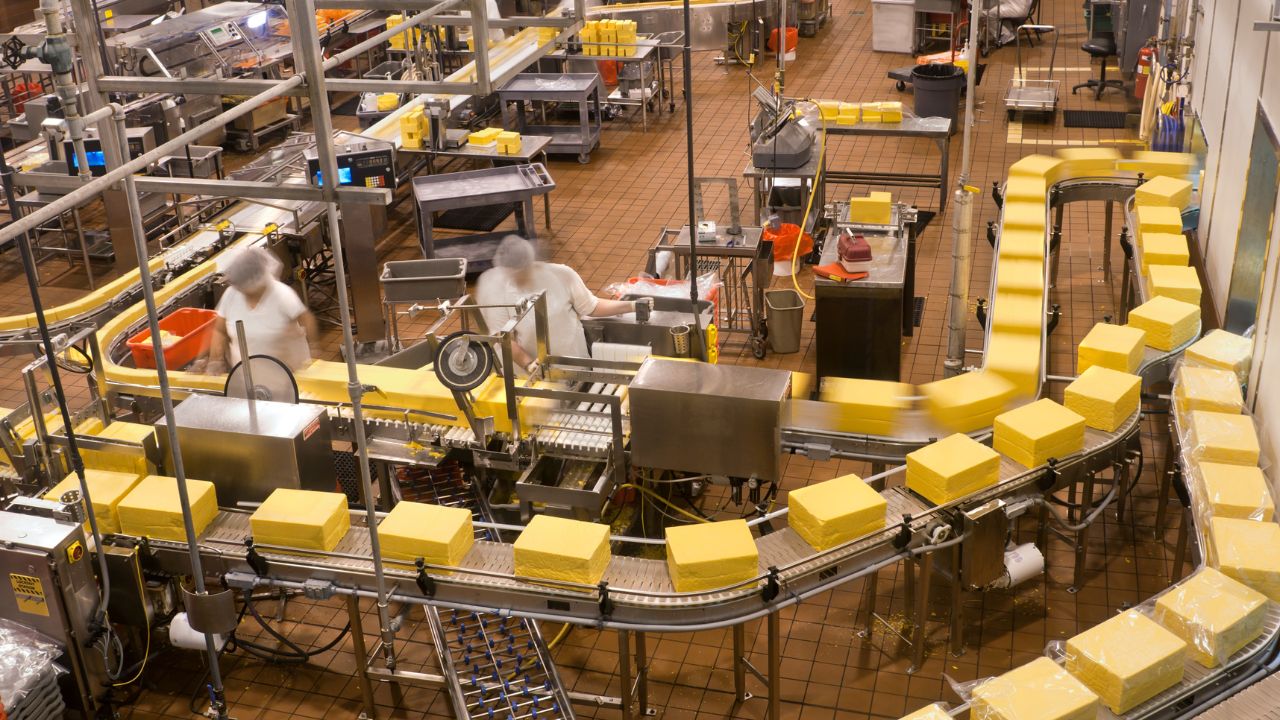
What Are Packaging Machines And Why Do Manufacturers Need Them?
Packaging machines automate the filling, sealing, and handling of products from production to palletization. The U.S. packaging machinery market reached $10.9 billion in 2023 with 5.8% growth, driven by labor shortages and efficiency demands. Automation adoption now exceeds 80% in developed markets as manufacturers replace manual operations that can't scale.
The business case is straightforward: Food & Beverage operations average 53-70% OEE versus the world-class target of ≥85%. This gap represents millions in lost production. An automated packaging line reduces labor costs 30-40%, increases throughput 50-100%, and improves fill accuracy from ±2% to ±0.1%, cutting product giveaway by $95,000 annually on high-volume lines.
Products That Can Be Packaged:
Liquids: Low viscosity (water-like), high viscosity (paste-like), any viscosity for pouch applications
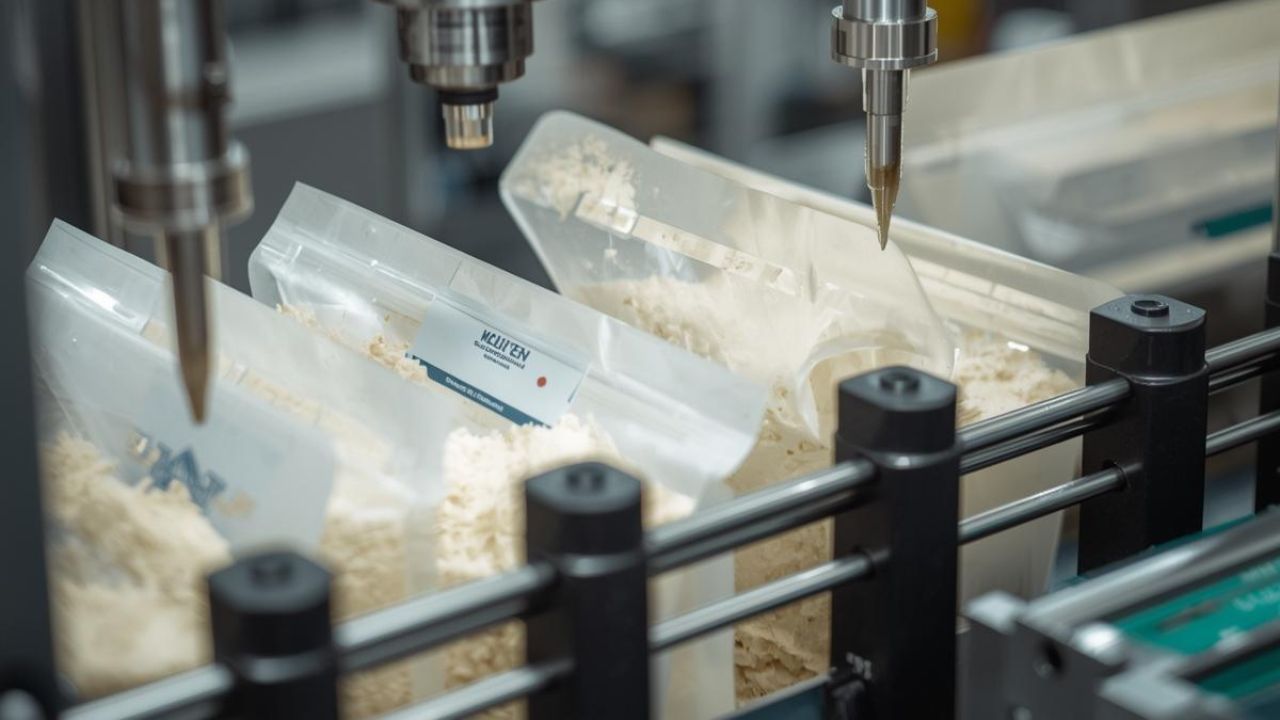
Powders: Free-flowing (flour, sugar) and non-free-flowing (protein powder, fine chemicals)
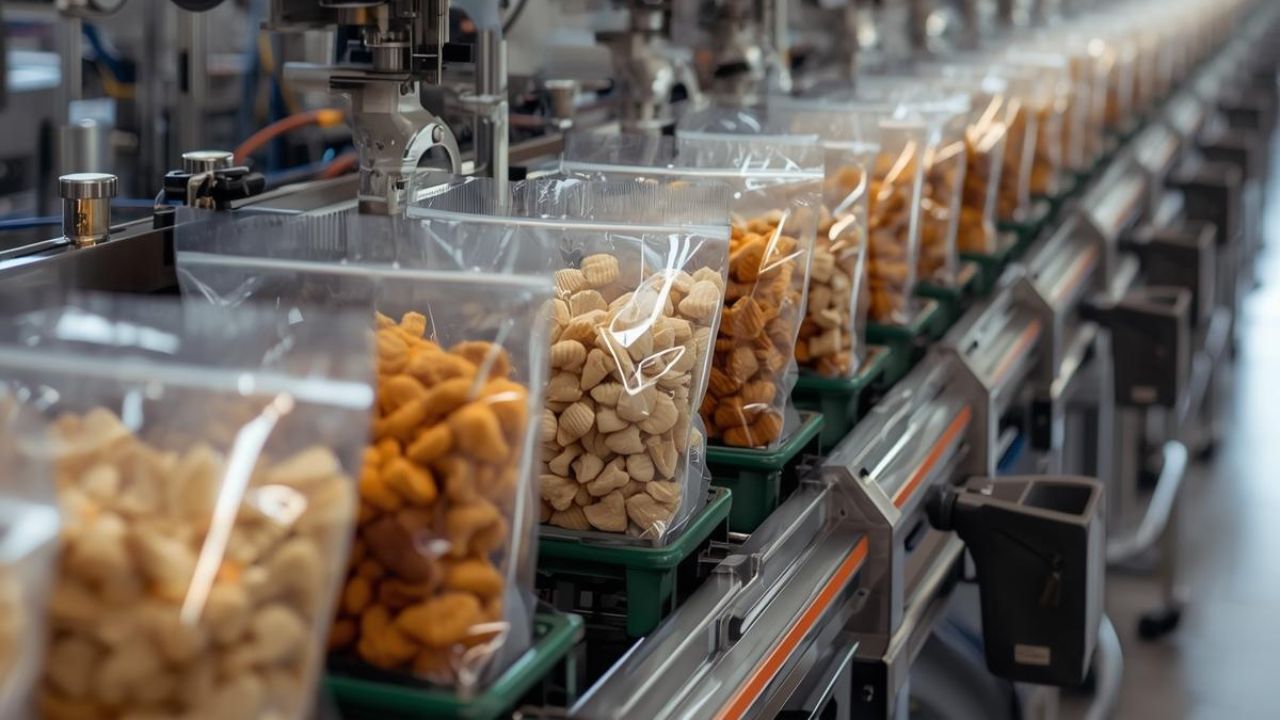
Granules & Particulates: Standard (coffee beans, nuts) and delicate (chips, cereals requiring gentle handling)
Types Of Packaging Machines And Their Applications
Primary packaging machines fall into five categories based on product type and pack format. Selection depends on three factors: product characteristics (viscosity, flowability, fragility), required throughput (bags or fills per minute), and accuracy specifications (±0.1% to ±2%).
Packaging Machine Comparison:
Machine Type
Speed Range
Cost Range
Best For
Accuracy
VFFS
30-120 bags/min
$35,000-$150,000
Free-flowing powders, granules
±1-2%
HFFS
20-100 packs/min
$50,000-$200,000
Solids, irregular shapes
±0.5mm placement
Piston/Gear Pump Filler
20-300 fills/min
$15,000-$120,000
Liquids (any viscosity)
±0.5%
Multihead Weigher + VFFS
30-210 bags/min
$80,000-$300,000
Delicate particulates
±0.1%
Tray Sealer (MAP)
15-100 trays/min
$80,000-$350,000
Fresh meat, cheese
±1% gas mix
Robotic Palletizer
8-25 cases/min
$100,000-$400,000
End-of-line secondary
5-15 min changeover
Key Performance Differentiators:
VFFS changeover: 5-15 minutes (gravity-fed, simple design) vs. HFFS: 15-30 minutes (complex die changes)
Multihead weigher accuracy (±0.1%) saves $95,000 annually vs. auger filler (±1-2%) for products costing $5/kg at 100g target weight across 1M packages, the difference compounds with volume
Robotic palletizers achieve 5-15 minute format changes vs. 20-40 minutes for conventional systems, directly improving OEE
How Packaging Machines Work: Step-By-Step Process
A complete packaging line moves product through six synchronized stages. Using a VFFS system with multihead weigher as the reference workflow:
Step 1: Product Infeed Product enters hopper systems feeding dosing equipment. Multihead weighers for particulates distribute product across an infeed funnel to 10-14 weigh buckets equipped with load cells. The system achieves ±0.1% accuracy at 30-210 weighments/min by combining multiple buckets to hit the target weight. A 12-head weigher makes 4,096 possible weight combinations per cycle.
Step 2: Film Handling Film rolls feed vertically downward around a forming collar, creating a tube shape. Tension control systems maintain a consistent film position during operation. Film specifications vary by product: LDPE requires 160-180°C sealing temperature, while PET demands 200-230°C.
Step 3: Filling Dosing systems discharge product into formed pouches:
Auger fillers: ±1-2% accuracy for powders using rotating screws
Piston fillers: ±0.5% accuracy for liquids via reciprocating pistons
Net weighers: ±0.1g accuracy for high-value products requiring gravimetric precision
Step 4: Sealing Heat sealing fuses thermoplastic layers through controlled application of temperature (160-230°C material-dependent), pressure, and dwell time. Ultrasonic sealing (20-40 kHz) serves heat-sensitive products without thermal damage. Seal integrity directly affects shelf life and regulatory compliance.
Step 5: Cutting & Quality Control Synchronized cutting separates finished packages. Inline inspection systems include:
Vision systems: ≥99.5% detection accuracy, <1% false reject rate for seal defects and printing errors
Checkweighers: ±0.1g to ±5g accuracy at 30-600 products/min, rejecting underweight/overweight packages
Metal detectors: Screen for ferrous (1.5-3mm), non-ferrous (2-4mm), and stainless steel (3-5mm) contaminants per HACCP requirements
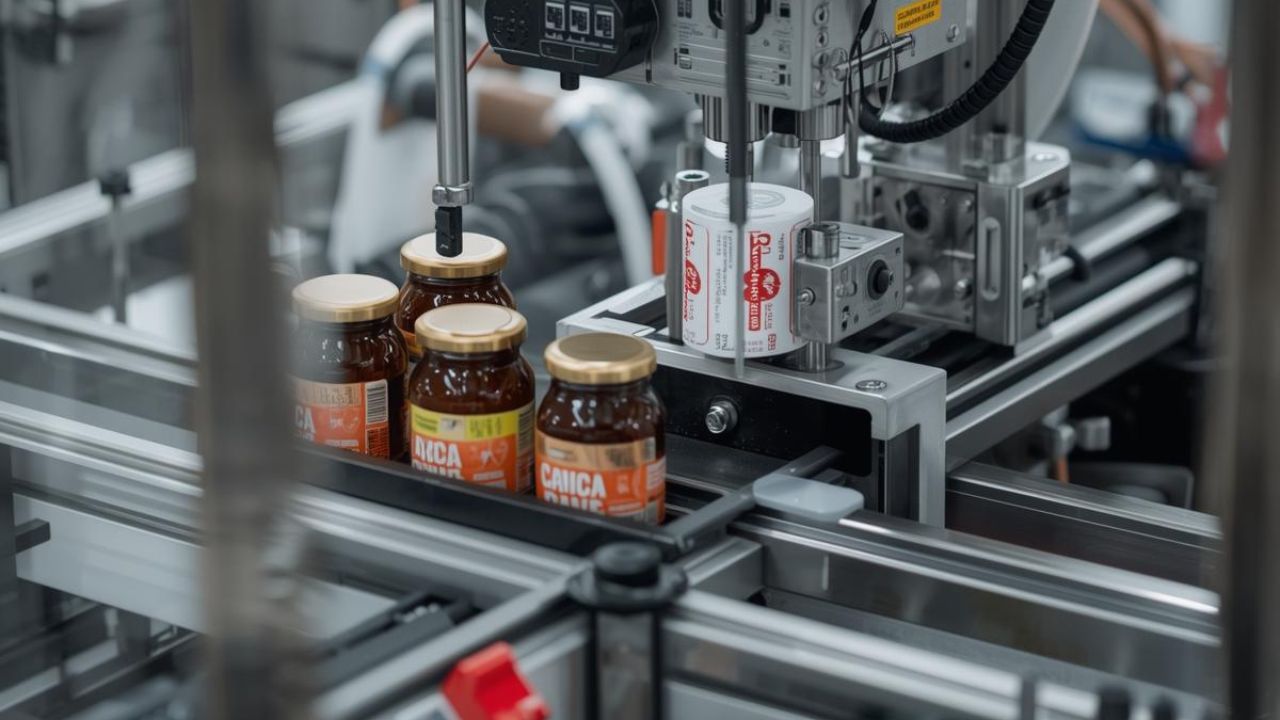
Step 6: Discharge Conveyors transport finished packages to secondary packaging. Coding/marking systems apply date codes, lot numbers, and traceability information for FSMA 204 compliance (effective January 20, 2026). Inkjet, laser, and thermal transfer technologies achieve 95-98% uptime.
Automated packaging equipment delivers measurable improvements across three critical areas: labor costs, production efficiency, and product quality. The financial case centers on labor reduction and throughput gains; a mid-sized manufacturer replacing manual operations typically sees $400,000 in annual labor savings while doubling output capacity.
Quality improvements drive additional savings through reduced giveaway and waste. Moving from manual filling (±2% accuracy) to automated systems (±0.1% accuracy) eliminates $95,000 in product loss annually on high-volume lines. Combined with faster changeovers and predictive maintenance capabilities, automation provides the pathway from industry-average 53-70% OEE to world-class ≥85% performance.
Efficiency & Cost Improvements:
Speed: 30-300 units/min automated vs. 3-15 units/min manual, 10x to 20x throughput increase
Labor Reduction: From 20 workers to 5 workers (75% reduction, $400,000/year savings at $60,000/worker fully loaded)
Accuracy Savings: ±0.1% vs. ±2% saves $95,000 annually (1M packages, $5/kg product at 100g target weight)
ROI: Robotic palletizers achieve 12-18 months payback through labor displacement and faster changeovers
OEE Improvement: Potential to move from 53-70% industry average to ≥85% world-class through downtime elimination
Changeover Impact: Reducing 30 minutes to 15 minutes (2 changes per 8-hour shift) improves OEE by 6-8 percentage points
Selecting The Right Packaging Machine
Machine selection requires matching equipment capabilities to four constraints: production volume, product characteristics, facility infrastructure, and total cost of ownership. The decision framework starts with throughput requirements, then filters by product-specific needs (viscosity, fragility, temperature sensitivity), and validates against utility capacity and regulatory compliance requirements.
Total Cost of Ownership over 5 years typically runs 6-7x the initial capital investment. Labor represents 62% of TCO, consumables 26%, making operational efficiency more critical than purchase price. Vendor selection weighs heavily; US-based suppliers deliver parts in 2-3 days versus 6-8 weeks overseas, reducing unplanned downtime by 30-50% through faster response times.
Key Selection Factors:
Production Scale: Startup (<20 units/min, $5K-$30K semi-automatic) to Enterprise (>400 units/min, $800K-$2M+ high-speed with robotics)
Product Characteristics: Viscosity (water-like to paste), flow properties (free-flowing to cohesive), delicacy (chips vs. granola), temperature sensitivity (frozen to ambient)
Facility Infrastructure: Compressed air (5-60 CFM @ 90 PSI), electrical power (10-100A, 480V/400V 3-phase), HVAC (60-75°F, 40-60% RH for film tension control)
Regulatory Requirements: IP54 (dry products, dust protected) to IP69K (meat/dairy, steam cleaning), 3-A/EHEDG hygienic certification for food contact
Total Cost of Ownership: 5-year TCO breakdown: Labor 62%, Consumables 26%, Capital 31%, Downtime 16%, Maintenance 15%
Changeover Speed: SMED-optimized designs reduce downtime 8-17% per shift through toolless adjustments and recipe management
Vendor Support: US-based parts availability (2-3 days) vs. overseas (6-8 weeks); guaranteed service response reduces downtime 30-50%
Common Challenges And Maintenance Requirements
Packaging lines face five recurring failure modes: film handling issues, inconsistent filling, seal defects, changeover delays, and utility contamination. Each directly impacts OEE through unplanned stops or reduced speed operation. Root cause typically traces to worn packaging machine components (seals, nozzles), process drift (temperature, pressure), or material variability (film thickness, product moisture).
Preventive maintenance follows a tiered schedule from daily visual inspections to quarterly comprehensive calibrations. The return on structured maintenance programs runs 5-10% OEE improvement through the elimination of unplanned stops. Predictive maintenance using IoT sensor data reduces downtime by an additional 30-50% by identifying failures before they occur.
Top Operational Issues & Solutions:
Film Breaks: Adjust tension control systems, verify film quality specifications; causes major OEE impact through line stops
Inconsistent Fills: Replace worn nozzles/seals, calibrate pressure regulators; drift typically occurs over 3-6 months
Seal Failures - "Three P's": Product contamination in seal area, Process issues (incorrect temperature/pressure/dwell time), Packaging material defects (thickness variation, contamination)
Changeover Delays: Implement SMED principles (external vs. internal setup), pre-stage changeover parts, use HMI digital checklists for consistency
Compressed Air Quality: ISO 8573-1 Class 1.4.1 required (oil-free, -40°F dew point) to prevent actuator failure and moisture contamination
Maintenance Frequency Summary:
Daily: Visual inspection of wear items, clean product contact surfaces, ATP swab test (<10 RLU for food safety validation)
Weekly: Lubricate moving parts with food-grade lubricants, inspect conveyor belts for wear, and verify metal detector calibration with test pieces
Monthly: Replace air filters, deep clean non-product contact components, calibrate load cells for weighing accuracy
Quarterly: Comprehensive sensor calibration (photoelectric, proximity), safety system functional testing (E-stops, interlocks), seal integrity tests per ASTM F88 standard
Predictive (Continuous): IoT monitoring of vibration, temperature, and pressure for 5-10% OEE improvement and 30-50% downtime reduction through early failure detection
Latest Packaging Machine Innovations (2023-2026)
The packaging machinery sector is experiencing rapid technological advancement driven by three converging forces: labor shortages accelerating automation adoption, regulatory pressure from FSMA 204 traceability requirements, and sustainability mandates pushing material innovation. These trends are reshaping equipment design and capabilities across all machine categories.
Industry 4.0 connectivity has moved from a premium feature to a standard specification. Cloud-enabled predictive maintenance and AI-based vision systems now appear in 29% of new installations, delivering real-time OEE monitoring and failure prediction before downtime occurs. Combined with servo-driven precision and digital changeover protocols, modern machines achieve consistently higher uptime and faster format changes than previous generations.
Key Technology Trends:
Industry 4.0 Integration: 29% of new installations include AI-based vision systems for defect detection; cloud-ready architectures enable predictive maintenance and remote diagnostics
Robotics Growth: Labor shortage crisis driving robotic/cobot palletizer adoption; 5-15 minute format changeover vs. 20-40 minutes for conventional systems
Sustainable Materials: Specialized sealing technology for biodegradable/compostable films requiring narrower processing windows (±5°F vs. ±15°F for standard plastics)
FSMA 204 Compliance: Automated Traceability Lot Code (TLC) coding/marking systems required by January 20, 2026, for food traceability list products
Servo-Driven Precision: 0.5% filling accuracy vs. 1-2% for legacy clutch-brake systems; eliminates mechanical variability
Digital Changeover: HMI-guided procedures with visual checklists reduce VFFS changeover from 10-20 minutes to 5-15 minutes through operator consistency
Sustainability And Eco-Friendly Packaging
Equipment efficiency directly impacts environmental footprint through three mechanisms: material waste reduction, equipment lifecycle extension, and resource consumption during cleaning. Improving fill accuracy from ±2% to ±0.1% eliminates product giveaway waste, at 1 million packages annually, which prevents 20,000 kg of product from entering landfills while recovering $100,000 in material costs.
Modern packaging machines are designed for 15+ year operational lifespans versus 7-10 years for commodity equipment, reducing replacement cycles and associated manufacturing emissions. Automated CIP (Clean-In-Place) systems cut water consumption 40-60% and chemical usage 30-50% compared to manual cleaning while delivering superior sanitation consistency. The sustainability case aligns with cost reduction; less waste means lower operating costs.
Sustainable Material Considerations:
Biodegradable Films (PLA/PHA): Compostable in industrial facilities; +30-50% material cost premium; requires specialized sealing due to lower heat tolerance
Mono-Material Structures: 100% recyclable single-polymer construction (all-PE, all-PP); +10-20% material cost; excellent machine compatibility with standard equipment
Recycled Plastics (rPET/rPE): Closes material loop; +5-15% cost versus virgin resin; good compatibility with calibration adjustments for density variation
Processing Challenges: Narrower sealing temperature windows (±5°F vs. ±15°F standard), lower seal strength requiring validation, FDA compliance for food contact recycled content
Machine Adaptations: Enhanced temperature control systems (±2°F precision), ultrasonic sealing options for heat-sensitive materials, material testing protocols for new substrates
Understanding Costs And Return On Investment
Total Cost of Ownership over 5 years runs 6-7x the initial capital investment, with labor dominating at 62% of TCO. This financial reality shifts the purchasing decision from equipment price to operational efficiency. A $150K machine that reduces labor by 3 workers ($180K annually) delivers better ROI than a $100K machine requiring 5 workers, despite the higher upfront cost.
Downtime represents 16% of TCO ($75K over 5 years for a mid-range line), making vendor support and parts availability critical financial factors. US-based manufacturers delivering parts in 2-3 days versus 6-8 weeks overseas prevent $15,000-$30,000 in lost production per incident. The ROI calculation must account for both direct savings (labor, materials) and avoided costs (downtime, quality defects).
5-Year TCO Breakdown ($150K Machine Example):
Capital Equipment: 31% ($150K) - one-time investment
Labor: 62% ($300K) - largest ongoing cost at $60K/worker/year fully loaded
Consumables: 26% ($125K) - film, ink, labels, replacement parts
Downtime: 16% ($75K) - lost production from unplanned stops and quality issues
Maintenance: 15% ($74.5K) - scheduled service, repairs, spare parts inventory
Total 5-Year TCO: $923K (6-7x initial capital cost demonstrates operational cost dominance)
ROI by Machine Type:
Machine Type
Investment
Annual Labor Savings
Payback Period
Key Impact
Semi-Auto VFFS
$30K-$100K
$60K-$120K
2-4 years
3-4x throughput increase
Multihead Weigher
$80K-$300K
$120K + $95K material savings
1-2 years
±0.1% accuracy eliminates giveaway
Robotic Palletizer
$100K-$400K
$120K-$180K
12-18 months
24/7 operation, consistent performance
IP69K Upgrade
+$15K-$75K
$30K-$45K cleaning labor
18-24 months
Heavy washdown capability, reduced cleaning time
Getting Started With Packaging Automation
Packaging automation offers significant financial benefits, with labor costs representing 62% of the Total Cost of Ownership over five years. With payback periods of 12-48 months, automation can improve accuracy, reduce material waste, and increase overall equipment effectiveness (OEE) by 6-15 percentage points. US-based vendors offer faster parts delivery, preventing costly production delays. The industry is rapidly adopting sustainable materials, AI-based vision systems, and Industry 4.0 connectivity, making automation increasingly essential.
Manufacturers who delay automation risk rising labor costs and falling behind competitors in achieving high OEE. To get started, manufacturers should assess throughput, product characteristics, and infrastructure needs, research vendors, perform due diligence, and plan for installation. Monitoring OEE metrics and leveraging predictive maintenance can drive continuous improvement.
Ready to automate your packaging line with American-made reliability? Contact Wolf Packing's engineering team for a free consultation and ROI assessment tailored to your operation.
At Wolf-Packing Machine Company, we believe that the key to success is a commitment to excellence in everything we do. That’s why we use only the highest quality materials and the most advanced technology to create packaging machines that are efficient, reliable, and cost-effective.
What’s new at Wolf Packing?
// <#?php
// /**
// * Exclude Current Posts from the query
// */
// add_action( 'pre_get_posts', function ( $query ) {
// // not an admin page and not the main query
// if ( ! is_admin() && ! $query->is_main_query() ) {
// $query->set( 'post__not_in', array( get_the_ID() ) );
// }
// } );
// ?>
Key Takeaways Packaging machinery investments shape production efficiency and profitability for years. While imported equipment advertises lower initial…
From design through testing, installation and beyond, we work tirelessly to ensure your equipment is running at peak performance and maximizing your application. To learn more about our machines, reach out to set up a free consultation with our in-house experts.
From weigh filling, bagging, wrapping and conveying to capping, labeling, cartoning, case/tray forming, packing and palletizing, we offer packaging solutions for a diverse array of applications.