Key Takeaways:
- Vibration sensors provide 8 to 12 weeks' advance warning for bearing failures by detecting changes in frequency patterns indicating wear and misalignment.
- Companies like BMW and Toyota use AI-powered motor current monitoring to predict equipment failures before they occur in packaging operations.
- Predictive maintenance minimizes unplanned downtime by identifying potential issues before they escalate, allowing scheduled maintenance during planned downtime.
- Most packaging facilities achieve 12 to 18-month payback periods with 40% to 60% reduction in unplanned equipment failures.
- IoT sensors must be strategically placed to capture temperature, vibration, humidity, and pressure parameters for optimal diagnostic value in packaging environments.
Predictive maintenance uses real-time sensor data to detect equipment degradation before failures occur. IoT sensors monitor vibration, temperature, motor current, and environmental conditions across packaging machinery and auxiliary manufacturing machines. Data analytics identify patterns indicating bearing wear, overheating, and mechanical imbalance. This guide explains sensor selection, implementation steps, and ROI calculation for packaging operations adopting predictive maintenance strategies.
What is predictive maintenance in modern packaging operations?
Predictive maintenance monitors equipment condition continuously and schedules interventions based on actual degradation rather than calendar intervals or reactive responses.
How does predictive maintenance differ from reactive and preventive strategies?
Reactive maintenance waits for failures, causing unplanned downtime and emergency repairs. Preventive maintenance follows fixed schedules regardless of condition. Predictive maintenance avoids unnecessary maintenance tasks by addressing needs based on actual equipment condition rather than fixed schedules. It analyzes sensor data to identify degradation trends and schedules maintenance only when needed.
Which packaging machine types benefit most from IoT-based condition monitoring?
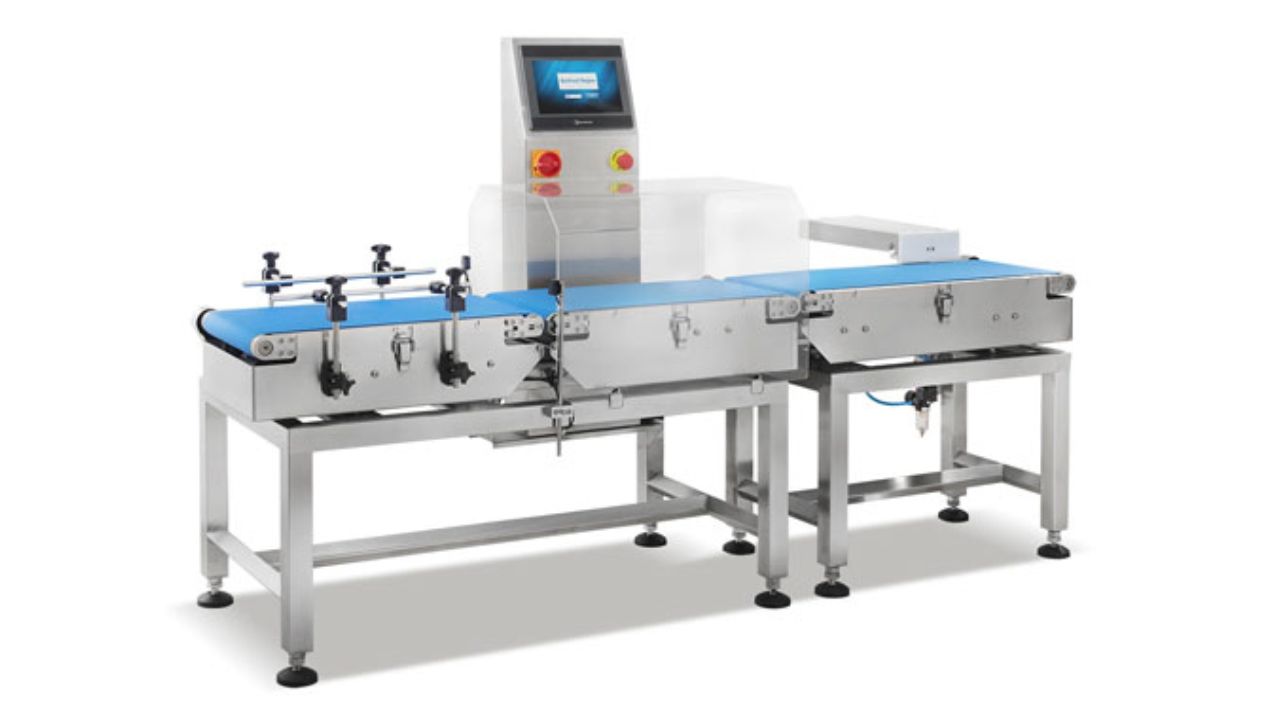
High-speed rotating equipment benefits most. VFFS machines, flow wrappers, pouch fillers, case packers, and palletizers contain motors and gearboxes subject to bearing wear. Sealing systems experience thermal cycling. Vacuum pumps operate under continuous mechanical load. Equipment operating above 60 cycles per minute or running extended shifts justifies sensor deployment.
Which failure modes in packaging equipment are most predictable using sensor data?
Bearing failures, motor overheating, belt misalignment, gearbox wear, vacuum pump degradation, and electrical faults produce detectable signatures before catastrophic failure. Vibration patterns change as bearings wear. Temperature rises precede motor burnout. Current draw increases as mechanical friction escalates. Predictable failures account for 70% to 85% of packaging equipment breakdowns.
Why are IoT sensors essential for predictive maintenance in packaging lines?
IoT sensors provide continuous, objective equipment health data that human observation cannot match. They detect gradual changes invisible during visual inspections.
How do real-time sensors reduce unplanned downtime and catastrophic failures?
IoT enables real-time monitoring and failure prediction across packaging equipment. Predictive maintenance minimizes unplanned downtime by identifying potential issues before they escalate into major failures. Sensors detect early-stage degradation weeks or months before complete failure. ROI benefits from reduced downtime and catastrophic failure prevention are the primary drivers for implementing IoT sensor systems. Early detection allows scheduled maintenance during planned downtime.
How does predictive maintenance improve OEE, throughput, and changeover stability?
Predictive maintenance ensures equipment operates at optimal performance levels, leading to higher productivity, reduced energy consumption, and improved product quality across packaging operations. Well-maintained equipment runs at rated speeds without degradation. Reduced breakdowns increase availability. Energy consumption drops when motors and drives operate without excessive friction.
How does PdM extend equipment lifespan and reduce maintenance costs?
Regular monitoring and timely maintenance interventions extend the lifespan of manufacturing equipment by addressing issues at an early stage and preventing excessive wear and tear. Predictive maintenance allows manufacturers to schedule maintenance during planned downtime, protecting production schedules. Maintenance costs decrease because parts are replaced based on condition, and emergency service premiums are eliminated.
Which IoT sensors provide the highest diagnostic value for packaging machinery?
Four sensor types deliver the majority of predictive value: vibration, temperature, motor current, and humidity. Each detects specific failure modes critical to packaging equipment reliability.
How do vibration sensors detect bearing wear, misalignment, and mechanical imbalance?
Vibration sensors are crucial for identifying mechanical problems in rotating equipment like motors, pumps, and compressors. These sensors detect changes in vibration patterns indicating imbalances, misalignments, or bearing wear before catastrophic failures occur. Healthy bearings produce consistent low-frequency vibration. Damaged bearings generate higher frequencies and irregular patterns. Vibration monitoring provides 8 to 12 weeks' advance warning for most bearing failures.
How do temperature sensors identify overheating in motors, sealing jaws, and electrical cabinets?
Temperature sensors monitor the thermal condition of machinery, motors, and critical components throughout packaging equipment. Abnormal temperature variations signal overheating, lubrication problems, or electrical faults that require immediate attention. Motors operating above baseline temperatures indicate bearing problems or inadequate ventilation. Sealing jaws exceeding optimal temperatures produce weak seals. Electrical cabinets showing rising temperatures indicate loose connections or overloaded circuits.
How do motor-current sensors detect hidden degradation in drives and rotating systems?
Electrical sensors continuously track power and current levels to optimize energy usage, reduce operational costs, and prevent equipment failures by identifying irregularities before they lead to significant problems. Companies like BMW and Toyota use AI for motor current monitoring to predict equipment failures before they occur. Current signature analysis detects mechanical resistance, electrical faults, and load variations invisible to vibration and temperature sensors.
How do humidity and moisture sensors protect machinery in food, beverage, and powder environments?
Humidity and moisture sensors monitor moisture levels that can impact equipment performance in food-grade and powder-handling environments. Excessive humidity can lead to corrosion and electrical short circuits, making these sensors critical in sanitary packaging applications. High humidity accelerates corrosion in electrical enclosures. Condensation causes electrical shorts and component failures. Moisture sensors alert maintenance teams before equipment damage occurs.
Which packaging machines and components should be prioritized for sensor deployment?
Sensor deployment follows a risk-based priority model. High-value equipment, bottleneck machines, and components with frequent failure history receive sensors first.
How do you identify bottleneck machines and high-risk failure points?
Bottleneck machines limit overall line throughput. Review maintenance logs to identify machines with the highest failure frequency. Calculate downtime cost for each asset to quantify financial risk. Equipment requiring extended lead times for replacement parts justifies sensor investment. Machines operating continuously without backup units become high-priority targets.
Which components—motors, gearboxes, film feed assemblies, vacuum pumps—are most critical?
Motors driving primary packaging equipment receive first priority. Gearboxes transmit power and experience wear under continuous load. Film feed assemblies control material tension—critical for package quality. Vacuum pumps enable product handling. Sealing mechanisms determine package integrity. Bearings support rotating assemblies and fail predictably. Prioritize components whose failure stops production or creates quality issues.
How do product type, speed, and environmental exposure influence sensor priority?
Abrasive products accelerate wear. High-speed equipment generates more heat and mechanical stress. Multi-shift operations increase cumulative wear. Harsh environments—high humidity, temperature extremes, dust—accelerate degradation. Products requiring frequent washdowns expose equipment to moisture and thermal cycling. Speed above 100 cycles per minute justifies continuous monitoring.
What are the main steps to implementing IoT sensors for predictive maintenance?
Implementation follows a structured five-step process: define objectives, select sensors, design data architecture, configure analytics, and scale deployment.
Step 1 — How do you define objectives, scope, and PdM success metrics?
Clearly define the objectives of the predictive maintenance program and determine which equipment or systems will be monitored before sensor deployment begins. Establish baseline metrics: current downtime hours, maintenance costs, and mean time between failures. Set improvement targets: 30% downtime reduction, 20% maintenance cost reduction. Define which machines enter the initial pilot. Document decision criteria for maintenance interventions triggered by sensor alerts.
Step 2 — How do you select sensor types, measurement parameters, and mounting locations?
Install IoT sensors on selected equipment to collect real-time data. Ensure sensors are strategically placed to capture relevant parameters such as temperature, vibration, humidity, and pressure for optimal diagnostic value. Match sensor types to failure modes: vibration sensors on bearings, temperature sensors on motors, and current sensors on electrical panels. Determine sampling frequency requirements. Select industrial-grade sensors rated for packaging environments. Identify mounting locations providing clear measurement paths.
Step 3 — How do you design the data pipeline (edge → gateway → cloud/on-prem analytics)?
Edge devices collect sensor data and perform initial processing. Gateways aggregate data from multiple sensors and transmit it to analytics platforms. Cloud platforms offer scalability and advanced analytics. On-premise systems provide data control and reduced latency. Edge processing reduces data transmission by filtering noise and calculating summary statistics. Architecture must support both real-time monitoring and long-term trend analysis.
Step 4 — How do you configure thresholds, alerts, and automated maintenance workflows?
Establish baseline operating ranges for each monitored parameter. Configure alert thresholds at multiple severity levels: advisory, warning, critical. Integrate alerts with work order systems to automatically generate maintenance tasks. Define escalation paths for unacknowledged alerts. Configure alert delivery methods: email, SMS, and dashboard notifications. Test alert logic to minimize false positives that create alert fatigue.
Step 5 — How do you pilot, validate, and scale PdM across multiple packaging lines?
Begin with 3 to 5 critical assets for pilot deployment. Monitor pilot assets for 90 days to validate sensor performance and refine alert thresholds. Track pilot outcomes: detected issues, avoided failures, and false alert rate. After successful validation, expand to additional assets using standardized sensor configurations. Develop standard sensor kits for common machine types to accelerate deployment.
How does data flow from IoT sensors into packaging analytics and maintenance systems?
Data architecture connects physical sensors to analytics platforms through structured processing layers. Each layer performs specific functions supporting predictive insights.
How do edge devices preprocess high-frequency vibration, temperature, and current data?
Edge processors filter noise, calculate summary statistics, and detect threshold violations locally. High-frequency vibration data generates megabytes per second. Edge devices calculate RMS values and frequency spectra, transmitting only processed results. Temperature sensors average readings over time intervals. Edge processing reduces network bandwidth requirements by 90% to 95% while preserving diagnostic information.
How do cloud and on-premise PdM platforms store, model, and visualize machine health?
PdM platforms ingest sensor data streams and store time-series measurements. Analytics engines apply algorithms to detect anomalies and predict failures. Machine learning models identify patterns indicating developing problems. Visualization dashboards display current equipment status and trend charts. Cloud platforms offer elastic scalability and advanced AI capabilities. On-premise platforms provide data sovereignty and reduced latency.
How does PdM integrate with CMMS, SCADA, MES, and line-integration systems?
APIs link PdM platforms to computerized maintenance management systems, automatically creating work orders when alerts trigger. SCADA integration provides a production context. MES integration enables predictive insights to influence production scheduling. Line-integration systems use equipment health data to optimize production sequences. Integrated systems create closed-loop workflows where predictions trigger actions automatically.
How should predictive models for packaging machinery be trained and maintained?
Predictive models require training data, validation testing, and continuous refinement. Model accuracy improves over time as failure patterns are documented.
How do rule-based thresholds compare with advanced analytics and ML-based anomaly detection?
Rule-based systems trigger alerts when measurements exceed fixed thresholds. They're simple to configure but generate false alerts when operating conditions change. Machine learning models learn normal operating patterns and detect deviations indicating problems. ML models adapt to seasonal variations and product changeovers. Rule-based systems work well initially. ML models deliver superior performance after accumulating 6 to 12 months of training data.
How do you collect labeled failures, interventions, and operating states to train models?
Document every maintenance intervention with detailed failure descriptions and sensor readings preceding the event. Label data with equipment states: normal operation, degraded condition, imminent failure. Record environmental conditions and operating speeds during failure events. Collect pre-failure sensor data spanning weeks before each documented failure. Build failure libraries containing labeled examples for each failure mode.
How do you validate accuracy, avoid false alarms, and tune detection thresholds?
Split historical data into training and testing sets. Train models on 70% of the data and validate on the remaining 30%. Calculate the detection rate and false alarm rate. Adjust thresholds to balance detection sensitivity against false alert frequency. Monitor alert rates after deployment and refine thresholds based on operator feedback. Continuous validation maintains model accuracy as equipment ages.
What cybersecurity and data-governance safeguards are required for IoT PdM systems?
Industrial IoT systems introduce cybersecurity risks requiring specific safeguards. Data governance ensures information is protected and properly managed.
How do you secure sensor networks, gateways, and remote connectivity in packaging plants?
Implement network segmentation, separating operational technology from information technology networks. Encrypt data transmission between sensors, gateways, and analytics platforms. Authenticate all devices connecting to sensor networks. Apply security patches and firmware updates regularly. Use VPNs for remote access. Monitor networks for unauthorized access attempts. Implement role-based access control, limiting who can view or modify system configurations.
How do you manage data ownership, compliance, retention, and audit requirements?
Define data ownership clearly. Document data retention policies specifying storage duration. Ensure compliance with relevant regulations. Implement audit trails tracking all system access and configuration changes. Backup data regularly and test restoration procedures. Define data sharing agreements with equipment vendors. Establish governance committees overseeing PdM data management policies.
How do you design resilient architectures that protect uptime while enabling analytics?
Design systems with redundancy at critical points: dual network paths, backup gateways, redundant servers. Enable edge devices to continue local monitoring if connectivity fails. Buffer data locally during network outages. Implement fail-safe behaviors. Use read-only connections for analytics platforms accessing production data. Design architectures where analytics failures don't impact production operations.
How do you calculate the ROI of predictive maintenance for packaging equipment?
ROI calculation compares implementation costs against quantified benefits. Most packaging operations achieve 18 to 24-month payback.
How do you quantify avoided downtime, production loss, and emergency repair costs?
Calculate current annual downtime hours caused by unexpected equipment failures. Multiply downtime hours by hourly production value. Add emergency repair premiums—overtime labor, expedited parts shipping. Project PdM reduction: 40% to 60% fewer unplanned failures. Calculate annual savings as current failure costs × reduction percentage. Include reduced scrap from quality issues and improved delivery reliability.
How do you evaluate sensor hardware, installation, and software subscription costs?
Sensor hardware costs $200 to $2,000 per monitoring point. Installation labor adds $500 to $1,500 per sensor. Gateway infrastructure costs $2,000 to $10,000 per line. Software platforms charge $50 to $200 per monitored asset monthly. Integration adds one-time costs of $10,000 to $50,000. The total first-year cost for monitoring 20 critical assets typically ranges from $40,000 to $100,000.
How do you calculate breakeven timelines (often 12–18 months)?
Divide the total implementation cost by the annual savings to determine the payback period. Example: $60,000 implementation cost ÷ $50,000 annual savings = 1.2 years. Most packaging facilities achieve 12 to 18-month payback periods. Calculate NPV using 3 to 5-year time horizons and 8% to 12% discount rates. ROI improves in subsequent years because implementation costs are one-time, while benefits continue.
How should teams be trained to adopt predictive maintenance workflows?
Training ensures stakeholders understand their roles in predictive workflows. Change management addresses cultural resistance to data-driven maintenance decisions.
How do you upskill maintenance, production, and engineering staff for sensor-driven operations?
Train maintenance technicians to interpret sensor data, investigate alerts, and perform condition-based repairs on critical equipment like your vertical form fill and seal machine. Teach vibration analysis fundamentals and thermal imaging interpretation. Train production operators to recognize alert notifications. Educate engineering staff on sensor selection and data analysis. Develop training modules for each role: operators need alert awareness, technicians need diagnostic skills, and engineers need system architecture knowledge.
How do you align operators, technicians, and IT/OT teams around predictive workflows?
Establish cross-functional PdM teams including maintenance, operations, engineering, and IT representatives. Define clear roles for alert response and data analysis. Create communication protocols ensuring alerts reach appropriate personnel promptly. Hold regular review meetings analyzing PdM performance. Align incentives—reward teams for proactive interventions, preventing failures. Build trust in sensor data by validating predictions against actual equipment conditions.
How do you embed sensor checks, alerts, and maintenance tasks into daily routines?
Enhanced safety: Predictive maintenance identifies potential hazards before they result in accidents or injuries. Timely maintenance interventions reduce the risk of equipment malfunctions that could pose safety threats to workers during daily operations. Incorporate sensor verification into shift startup checklists. Display real-time equipment health dashboards in production areas. Include PdM alert status in production meetings. Add sensor-triggered maintenance tasks to daily work order queues.
What pitfalls commonly derail predictive maintenance projects—and how do you avoid them?
Understanding common failure modes enables proactive mitigation. Most PdM projects fail due to poor planning, inadequate change management, or insufficient data quality.
Why do PdM pilots fail to scale in packaging facilities?
Pilots succeed, but expansion stalls when implementations lack standardization. Custom sensor configurations for each machine prevent efficient scaling. Insufficient training leaves staff unable to manage larger deployments. Avoid scaling failures by designing standardized sensor kits, securing multi-year budgets, training internal champions, and selecting platforms supporting diverse equipment types. Document lessons learned during pilots.
How can you prevent incorrect sensor placement, low-quality signals, or alert fatigue?
Incorrect sensor placement produces unreliable data. Consult equipment OEMs for optimal mounting locations. Specify industrial-grade sensors designed for harsh environments. Alert fatigue occurs when threshold settings generate excessive false positives. Start with conservative thresholds and tighten gradually. Implement multi-level alerts prioritizing critical warnings. Regularly review alert rates and adjust configurations.
How do standardization, governance, and documentation support long-term PdM maturity?
Standardization creates repeatable processes enabling efficient scaling. Develop standard sensor configurations for each machine type. Create installation guides with photos and mounting specifications. Governance ensures accountability: assign ownership for PdM program management and data quality. Documentation captures institutional knowledge: record alert response procedures, failure case studies, and troubleshooting guides.
What key questions should teams answer before launching a predictive maintenance program?
Pre-launch planning addresses critical decisions determining program success. Clear answers guide resource allocation and implementation priorities.
Which packaging assets and failure modes will be targeted in Phase 1?
Identify 3 to 5 critical assets for initial deployment. Select equipment with documented failure history, high downtime costs, or bottleneck positions. Target failure modes with clear sensor-detectable signatures: bearing wear, motor overheating, and misalignment. Phase 1 scope should demonstrate value while ensuring success. Document selection rationale and success criteria.
Which OEMs, integrators, and internal teams own the PdM deployment?
Assign executive sponsorship, ensuring program visibility. Designate an internal project manager coordinating activities across maintenance, operations, IT, and engineering. Identify equipment OEMs providing technical specifications. Select system integrators or PdM platform vendors delivering sensor installation and analytics software. Define roles clearly: who procures sensors, who installs hardware, who configures software.
What timeline, budget, and KPIs define success for the implementation roadmap?
Define implementation timeline: 3 months for planning, 2 months for pilot installation, 3 months for validation, 6 months for scaling. Typical first-year budgets range from $50,000 to $150,000. Define success KPIs: 30% reduction in unplanned downtime, 25% decrease in maintenance costs, 50% fewer catastrophic failures. Set quarterly review milestones, tracking progress against targets.
Maximize Equipment Reliability with Predictive Intelligence
Wolf-Packing Machine Company integrates predictive maintenance capabilities into packaging solutions—from fillers to capping machine systems—helping manufacturers prevent failures and optimize asset performance. Our engineering team designs sensor-ready systems with monitoring points accessible for condition assessment. We partner with leading PdM platform providers to deliver complete solutions, including hardware, analytics, and training.
Contact Wolf-Packing today to discuss how predictive maintenance can transform your packaging equipment reliability and reduce operational costs.