Seasonal demand fluctuations driven by holidays and promotional events require agile packaging strategies. Without proactive planning, these surges lead to critical bottlenecks, material shortages, and excessive reliance on costly overtime labor. Effective scaling involves predictive capacity planning, equipment optimization, and strategic resource allocation.
This guide provides the frameworks, metrics, and decision tools to manage seasonal demand spikes efficiently, from baseline capacity assessment through post-peak continuous improvement.
Key Takeaways
Seasonal demand spikes require 6-9 months of advance planning to prevent capacity shortfalls
OEE analysis reveals 12-16% hidden performance losses before capital investment
SMED methodology can recover 3.55 production hours daily without new equipment
Flex capacity through overtime and temporary labor bridges 40% throughput gaps
Real-time KPI tracking maintains 99.5%+ quality standards at higher speeds
What Creates Seasonal Demand Spikes In Packaging Operations?
Seasonal demand spikes stem from predictable and unpredictable factors that compress production schedules and strain packaging capacity. Understanding these drivers enables early material procurement and capacity reservation for high-demand packaging solutions.
Main Demand Drivers:
Holiday peaks (Q4 demand surge)
Promotional events and marketing campaigns
New product launches requiring packaging line time
Demand volatility must be translated into machine-hours, labor shifts, and material procurement timelines to prevent capacity shortfalls.
How Do You Measure Whether Current Packaging Capacity Can Meet Peak Demand?
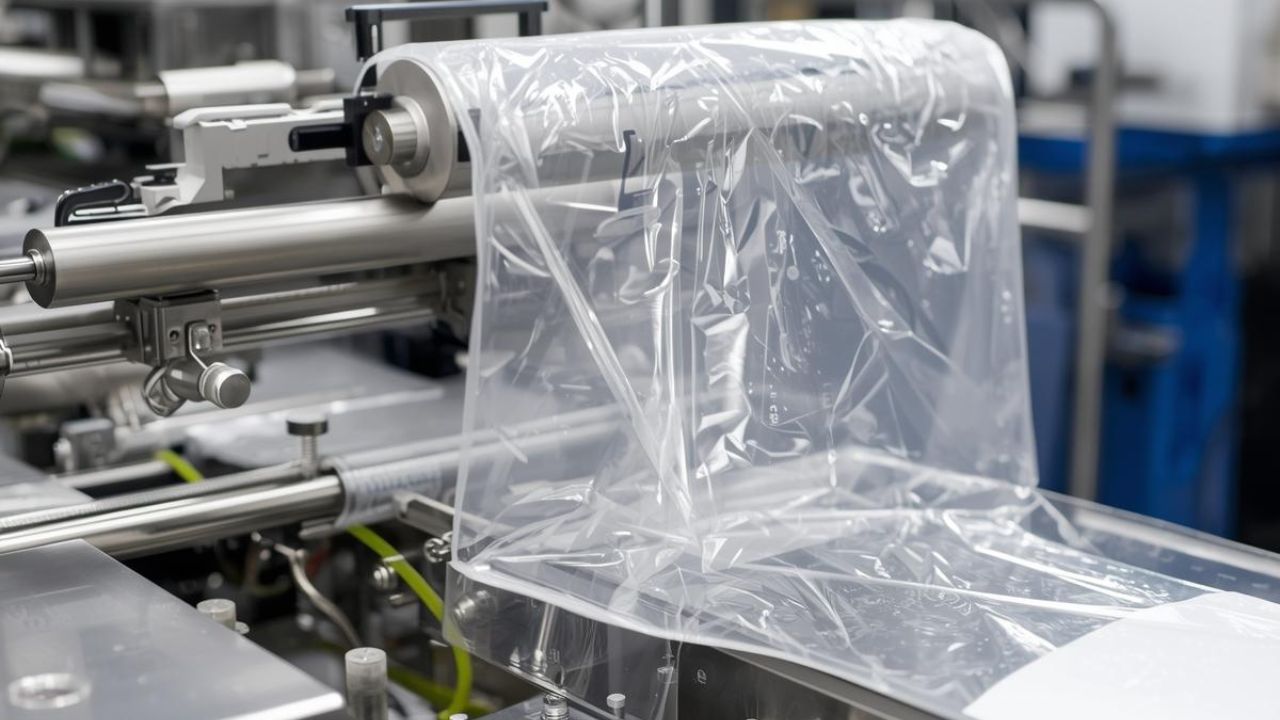
Nameplate speed alone doesn't reveal true peak capacity. A line rated for 250 packs per minute (PPM) may only deliver 210-220 PPM in practice due to hidden losses in availability, performance, and quality. Measuring actual capacity requires a comprehensive OEE analysis across weighers and fillers, sealing equipment, and labeling systems.
Core Capacity Metrics:
Actual throughput (PPM/CPM)
Overall Equipment Effectiveness (OEE)
Changeover time
Planned and unplanned downtime
Scrap rate
Labor utilization
Schedule adherence
Key Metric: OEE Formula
OEE = Availability × Performance × Quality
Availability: Ratio of Run Time to Planned Production Time
Performance: Actual output vs. theoretical maximum
Quality: Good units vs. Total units produced
Performance Loss Example: A packaging line designed for 250 PPM running at 210-220 PPM experiences a 12-16% performance loss from micro-stops, starvation, or blockages.
Metric
What It Measures
Why It Matters During Peaks
OEE (%)
Overall Equipment Effectiveness
12-16% performance loss reveals hidden capacity constraints
Changeover Time
Minutes between SKU switches
Long changeovers (80+ min) reduce available production time
Scrap Rate (%)
Rejected/reworked units
Increases when lines run faster to meet peak demand
Once the capacity gap is quantified, identify which specific bottlenecks limit throughput.
What Usually Limits Packaging Machine Output During Seasonal Peaks?
Throughput losses typically stem from system constraints and speed mismatches between stages rather than individual machines operating below capacity. Identifying the constraint enables targeted intervention when scaling packaging machine output for peak periods.
Common Bottlenecks:
Slow manual changeovers
Speed mismatches between filling, sealing, and labeling
Material shortages during peak demand
Operator shortages and insufficient training
Micro-stops and jam clearing
End-of-line palletizing constraints
Bottleneck
Root Cause
Effect on Peak Output
Manual Changeovers
Inefficient procedures (impact: -8.0)
Line stopped 80+ minutes between SKUs reduces daily capacity
Speed Mismatches
Filler at 55 CPM, labeler at 200 CPM
Entire line throttled to slowest stage
Micro-Stops
Sticky products (-7.5), irregular sizes (-6.0)
12-16% performance loss accumulates
Palletizing Constraints
Traditional systems cap at 300 layers/hr
Creates backpressure halting upstream packaging
Optimize existing equipment before major capital investment, as demonstrated by companies achieving 88% changeover reductions through process improvements on vertical form fill seal systems.
Should You Optimize Current Equipment Before Buying New Packaging Machinery?
Existing assets should be optimized before capital expansion. Process improvements can unlock more capacity than new equipment purchases at a fraction of the cost. A SMED case study demonstrates this: an 88% reduction in changeover time (from 80 minutes to 9 minutes) recovered 3.55 hours of production time daily across three changeovers, generating $7,100 additional revenue per day and $2.5M+ annually without capital investment.
Optimization Levers:
SMED methodology for changeover reduction
Preventive maintenance programs
Standard operating procedures
Operator cross-training
Spare parts inventory management
Recipe standardization
Scenario
Recommended Path
Capacity gap <20%, OEE <75%, changeover time >20 min
Optimize: SMED can recover 3.55 hrs/day; preventive maintenance improves OEE
Capacity gap >75%, OEE >85%, equipment at speed ceiling
Choose optimization if your OEE is below 75% and the changeover time exceeds 20 minutes. Choose an investment if your equipment operates at maximum design speed but still cannot meet demand.
Once optimization potential is assessed, develop a detailed pre-peak scaling plan combining process improvements with strategic capacity additions.
How Do You Scale Packaging Machine Output Before The Seasonal Peak Begins?
Scaling from baseline 150 CPM to peak demand of 262 CPM requires a phased approach: optimize equipment, activate flex capacity through overtime and temporary labor, and deploy overflow options for remaining gaps. This packaging throughput increase requires coordination across container and jar packaging systems and downstream handling equipment.
Baseline capacity at 150 CPM can reach 210 CPM (+40%) with flex capacity, but peak deficits still emerge: October (+45 CPM), November (+97 CPM), and December (+112 CPM).
Planning Actions:
Forecast demand and convert to required machine-hours
Audit current constraints using OEE analysis
Implement SMED to reduce changeover time
Hire and train temporary labor 2-3 months in advance
Secure packaging materials for 75% volume increase
Co-packing partnerships (outsource 20-30% of peak volume)
Temporary equipment leasing
As lines scale from 150 CPM to 210+ CPM, maintaining quality and safety becomes critical to sustainable throughput gains.
How Do You Increase Output Without Hurting Package Quality or Safety?
Higher throughput must not compromise seal integrity, labeling accuracy, operator safety, or regulatory compliance. Scaling from 150 CPM to 210 CPM (+40%) must maintain 99.5%+ accuracy and zero safety incidents across horizontal flow wrapping systems and other packaging equipment.
General packaging requires 99.5%+ fill accuracy, while pharmaceutical and nutraceutical applications demand 99.99% accuracy. Strict accuracy requirements create a -5.0 impact factor, potentially requiring slower speeds.
Quality Risks:
Poor seals (hermetic integrity fails at high speed)
Weight variation (accuracy degrades from 99.5% to 97%)
Ergonomic strain (repetitive motions at higher frequency)
Fatigue-related mistakes (extended shifts)
Risk Area
Preventive Control
Monitoring Method
Fill Accuracy
Recalibrate weighers; slow down if below 99.5%
SPC on every batch
Seal Integrity
Validate seal bar dwell time at target speed
Leak test every 500 units
Operator Safety
Enforce protocols; mandate lockout/tagout
Incident tracking
Real-time KPI monitoring during peak production ensures throughput gains deliver sustainable results rather than short-term spikes followed by quality failures.
Which KPIs Should You Track During The Seasonal Demand Spike?
Peak execution requires real-time visibility, not end-of-week reporting. During November-December peaks, waiting for weekly OEE reports means bottlenecks go unaddressed for 5-7 days, compounding capacity losses. Shift-by-shift tracking enables immediate intervention when performance deviates from targets.
Critical KPIs:
Actual throughput (PPM/CPM)
OEE by shift
Changeover duration per event
Downtime by root cause
Scrap and rework rates
Schedule attainment percentage
KPI
Why It Matters
Review Frequency
Actual Throughput
Validates if achieving 210 CPM flex target
Shift-by-shift
OEE
Identifies if 12-16% performance loss is improving
Shift-by-shift
Changeover Duration
Confirms 9-minute SMED vs. 80-minute baseline
Every changeover
Scrap Rate
Ensures quality doesn't degrade; target <2%
Batch-by-batch
Unsustainability Signals:
Scrap rate climbing from 2% to 5%+
Every shift running 2-4 hours overtime
Quality escapes and customer complaints increasing
These real-time KPIs guide post-season strategic decisions: optimize further, add flexible capacity, or invest in permanent equipment.
Should You Outsource, Lease, Or Invest In New Packaging Capacity After Peak Season?
After peak season, data reveals whether capacity deficits can be closed through optimization, flexible short-term capacity, or permanent equipment investment. Understanding the differences between semi-automatic and fully automatic packaging line automation helps determine the right investment level.
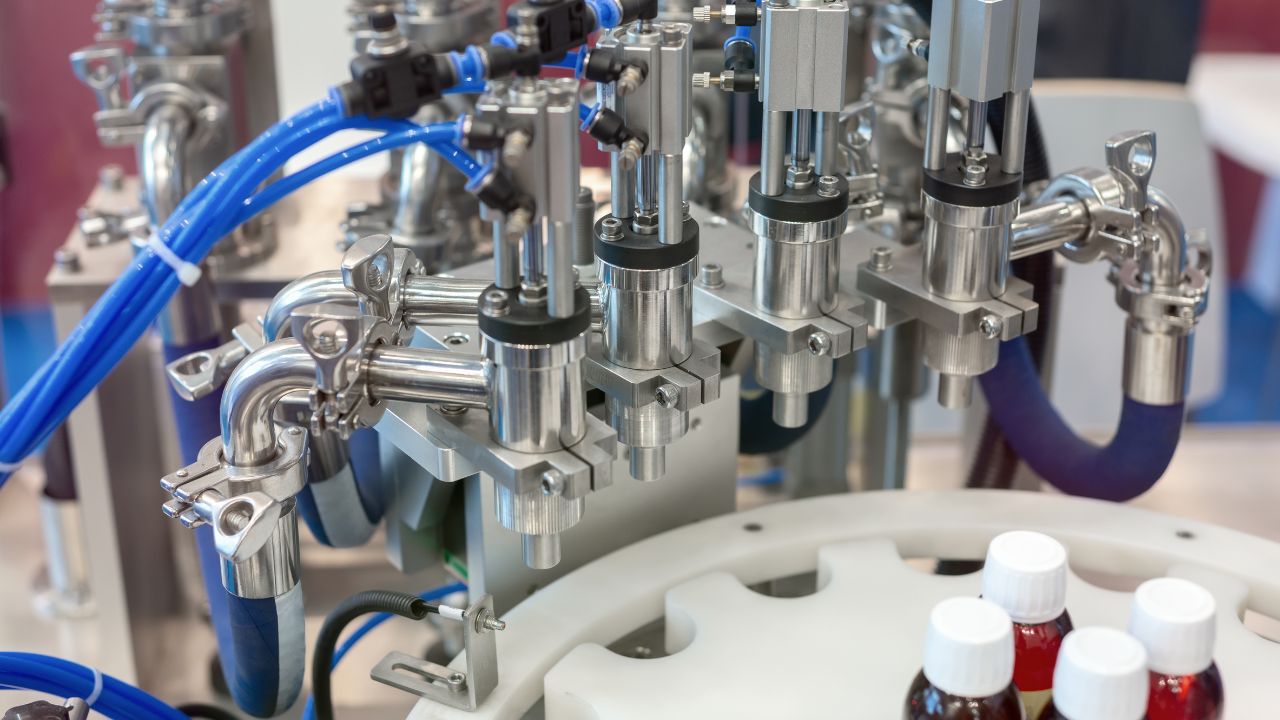
Machine throughput ranges inform these decisions: auger fillers operate at 20-100 CPM (typical 55 CPM) for powders, gravity fillers reach 35-1,200 CPM (typical 300 CPM) for liquids, and advanced palletizers achieve 570 layers/hr compared to traditional 300 layers/hr systems (+90% improvement).
Medium cost; overtime +50% labor cost; immediate deployment
Permanent Investment
Gap >75%; sustained growth; OEE >85%
High cost ($200K-$1M+); ROI 18-36 months; 6-12 month lead time
Decision Factors:
Repeatability of seasonal demand
Available capital budget
Labor availability and skill levels
Expected ROI and payback period
Choose optimization if peaks occur 2-3 months annually and OEE remains below 75%. Choose permanent investment if demand growth is sustained year-round and current equipment operates at maximum capacity.
Regardless of capacity path chosen, the post-season review captures lessons that convert temporary execution into repeatable capabilities.
What Should You Do After The Peak Season Ends?
Post-season review should convert temporary lessons into repeatable operating improvements. The November-December peak revealed specific bottlenecks and workarounds that must be institutionalized. Analyzing where output was lost, which SKUs disrupted changeover targets, and which countermeasures succeeded transforms reactive problem-solving into proactive capacity planning.
Post-Season Review Questions:
Where was output lost? (Which shifts/SKUs had highest downtime?)
Which SKUs were most disruptive to changeover targets?
Which bottlenecks repeated daily?
Which countermeasures worked? (Did overtime deliver expected output?)
Where did contingency planning fail?
Throughput Enhancement Factors:
Multi-channel equipment: Upgrading to 12/24-channel systems (+9.5 impact)
Advanced sensors: Vision systems vs. photoelectric (+7.0 impact)
By institutionalizing these post-season improvements, from 9-minute SMED changeovers to multi-channel equipment upgrades, manufacturers transform seasonal demand spikes from operational crises into predictable, manageable events that drive continuous capacity gains.
Need packaging equipment that scales with your seasonal demand? Wolf Packing Machine Company engineers customized filling, sealing, and labeling systems designed for flexibility and high-speed throughput. Contact our team to discuss your capacity requirements and ROI projections.
At Wolf-Packing Machine Company, we believe that the key to success is a commitment to excellence in everything we do. That’s why we use only the highest quality materials and the most advanced technology to create packaging machines that are efficient, reliable, and cost-effective.
What’s new at Wolf Packing?
// <#?php
// /**
// * Exclude Current Posts from the query
// */
// add_action( 'pre_get_posts', function ( $query ) {
// // not an admin page and not the main query
// if ( ! is_admin() && ! $query->is_main_query() ) {
// $query->set( 'post__not_in', array( get_the_ID() ) );
// }
// } );
// ?>
From design through testing, installation and beyond, we work tirelessly to ensure your equipment is running at peak performance and maximizing your application. To learn more about our machines, reach out to set up a free consultation with our in-house experts.
From weigh filling, bagging, wrapping and conveying to capping, labeling, cartoning, case/tray forming, packing and palletizing, we offer packaging solutions for a diverse array of applications.